




TABLE OF CONTENTS
Connection Pooling Explained: Fixing the Database Bottleneck Nobody Notices

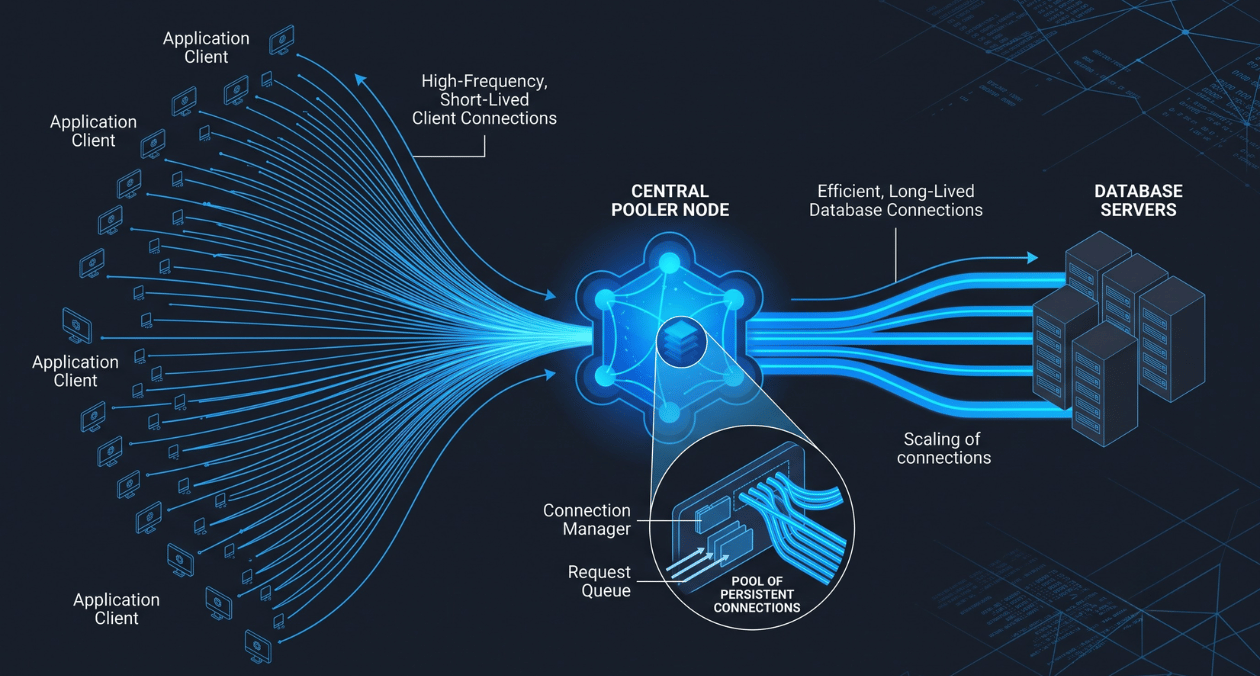
An application can pass every load test on paper and still fall over in production the moment real traffic hits, and the culprit is often something invisible in most monitoring dashboards until it is already causing outages: database connection exhaustion. Connection pooling fixes this specific bottleneck, and understanding why it matters is essential before scaling any database-backed application beyond a handful of concurrent users.
Why Raw Database Connections Do Not Scale
Every time an application opens a direct connection to PostgreSQL, the database forks a dedicated backend process to handle it, consuming memory, roughly 5 to 10 MB per connection, and CPU scheduling overhead regardless of whether that connection is actively running a query. A server configured for a few hundred max connections can exhaust available memory well before hitting that numeric limit, particularly as modern applications scale horizontally across many pods or serverless functions, each maintaining their own connections.
What a Connection Pooler Actually Does
A connection pooler like PgBouncer sits between your application and PostgreSQL, accepting potentially thousands of lightweight client connections and multiplexing them onto a much smaller pool of actual database connections. Because client connections to the pooler are cheap compared to real database connections, this dramatically increases how many concurrent clients a given database server can support without increasing memory pressure proportionally.
Pool Modes and What They Mean for Your Application
| Pool Mode | How It Works | Best Suited For |
| Session | Connection held for entire client session | Apps needing full feature compatibility |
| Transaction | Connection returned after each transaction | Most stateless web applications |
| Statement | Connection returned after each statement | Very high-concurrency, simple query workloads |
The Transaction Mode Trade-off Most Teams Miss
Transaction pooling mode delivers the most dramatic reduction in server-side connections and is the right default for most stateless web applications, but it breaks certain PostgreSQL features that assume a persistent session, including prepared statements that persist across transactions and SET commands issued outside a transaction block. Teams that adopt transaction mode without auditing their application’s query patterns for this dependency often hit confusing, intermittent bugs that are much harder to diagnose than the original connection exhaustion problem the pooler was meant to solve.
Sizing Your Pool Correctly
A pool that is too small shows up as clients waiting for an available connection, visible as sustained cl_waiting values in PgBouncer’s monitoring output. A pool that is too large defeats the purpose of pooling in the first place, since it simply shifts the same connection overhead problem from the application layer to the pooler layer. Starting with a pool size in the 20 to 30 range for typical OLTP web workloads, then adjusting based on observed wait times under real traffic, is a more reliable approach than guessing at a number upfront.
A Practical Rollout Approach
- Audit your application’s query patterns for dependencies on session-level PostgreSQL features
- Start with transaction mode unless that audit reveals a genuine compatibility issue
- Set an initial pool size based on your server’s CPU core count and workload type, then tune from there
- Monitor cl_waiting and connection saturation metrics continuously after rollout, not just during initial testing
According to PgBouncer’s own project documentation, the tool is specifically designed as a lightweight, transparent proxy that speaks the native PostgreSQL wire protocol, meaning most applications require no code changes at all to adopt it, which is one of the clearest reasons it has become the de facto standard for PostgreSQL connection pooling in production environments. Engineering teams debugging intermittent connection errors under load can review Askan’s broader database and reliability engineering coverage for related diagnostic approaches beyond pooling alone.
Most popular pages
-

Image Optimization for Web Performance: Formats and Compression
Ask a developer why a page feels slow, and the honest answer is often sitting right in the middle of it. A single unoptimised...
-

Monolith vs Microservices: Choosing the Right Architecture for Your Team
Microservices have dominated architecture conversations for years, to the point where choosing a monolith can feel like admitting you're behind the times. In practice,...
-

Magento Performance Tuning: Caching Layers Explained
Magento has a reputation for being resource-heavy, and while some of that is inherent to running a full-featured enterprise commerce platform, a large share...
Image Optimization for Web Performance: Formats and Compression
Ask a developer why a page feels slow, and the honest answer is often sitting right in the middle of it. A single unoptimised...
Monolith vs Microservices: Choosing the Right Architecture for Your Team
Microservices have dominated architecture conversations for years, to the point where choosing a monolith can feel like admitting you're behind the times. In practice,...
Magento Performance Tuning: Caching Layers Explained
Magento has a reputation for being resource-heavy, and while some of that is inherent to running a full-featured enterprise commerce platform, a large share...