


TABLE OF CONTENTS
Database Connection Pooling: Why Most Applications Are Doing It Wrong

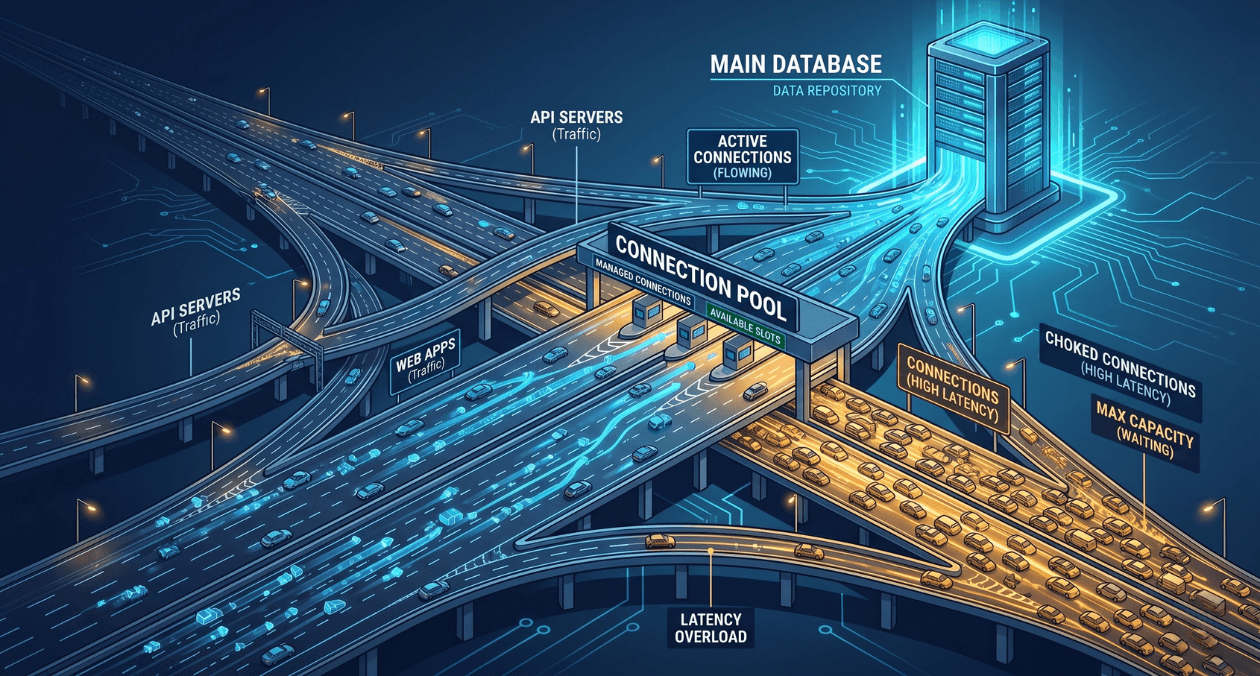
Connection pooling sits in a quiet corner of most backend architectures. It rarely appears in architecture diagrams, it generates no alerts until something goes badly wrong, and most engineers configure it once and never revisit it. That neglect is expensive. A misconfigured connection pool is one of the most common causes of database-related outages in applications that otherwise look perfectly healthy. The problem does not show up in unit tests. It shows up in production at 3 AM, when traffic spikes and every request starts timing out waiting for a connection that never becomes available.
This article walks through how connection pooling actually works, what most applications get wrong, and the specific configuration and architectural decisions that separate teams who never think about their pool from teams who have learned the hard way. The focus is on relational databases, primarily PostgreSQL, but the principles apply broadly. Whether you are using a built-in driver pool, PgBouncer, or a cloud-managed proxy, the failure modes are the same.
What Connection Pooling Actually Does
Every database connection is a real operating system resource. PostgreSQL, for example, spawns a new backend process for every connection. That process occupies memory, holds file descriptors, and has overhead associated with authentication, SSL handshake, and session setup. Opening a new connection for every database query is not a pattern that scales. Even at modest traffic levels, the overhead of connection setup adds latency and the sheer number of simultaneous connections begins to exhaust database server resources.
A connection pool solves this by maintaining a set of already-open connections and lending them to application threads or coroutines as needed. When a query completes, the connection is returned to the pool rather than closed. The next request borrows a connection from the pool, skips the setup overhead entirely, and returns it when done. In theory, this is straightforward. In practice, the configuration choices around pool size, connection lifetime, timeout behaviour, and pooling mode introduce a set of tradeoffs that most applications get wrong by using defaults that were never tuned for their workload.
Understanding the distinction between connection pooling at the application layer and at the proxy layer is also important. Libraries like HikariCP, SQLAlchemy, or node-postgres include built-in pools that live inside the application process. External poolers like PgBouncer sit between the application and the database as a separate process, multiplexing many application connections onto a smaller number of actual database connections. Each approach has different capabilities and limitations, particularly around transaction-level versus session-level pooling. For teams exploring how database technology choices relate to broader stack decisions, the MongoDB vs RDBMS comparison on the Askan blog covers where relational databases make sense versus document stores, which is a useful upstream context for why connection management matters more in relational systems.
The Most Common Pool Configuration Mistakes
Pool Size Set Too High
The most widespread mistake is setting the pool size too large. The intuition is understandable: more connections means more concurrency, which must mean better performance. The reality is the opposite beyond a certain point. PostgreSQL performance degrades significantly as the active connection count climbs because the database spends increasing time on lock contention, context switching between backend processes, and shared memory management. A PostgreSQL instance that performs well with 100 active connections can slow to a crawl at 500.
The widely cited formula from HikariCP’s documentation gives a useful starting point: pool size = (core count * 2) + effective disk spindles. For a modern NVMe system, this often means a surprisingly small number. A four-core application server connecting to a database with fast SSD storage might have an optimal pool size of nine or ten connections per application instance, not fifty or a hundred. This number should be derived from load testing and profiling, not guesswork.
Ignoring the Connection Lifetime and Eviction Settings
Database connections can go stale. Network infrastructure between application servers and databases, including load balancers, NAT gateways, and firewalls, often enforces idle connection timeouts silently. A connection that has been sitting idle in your pool for thirty minutes may be terminated at the network layer without the application knowing. When that connection is borrowed and used for a query, it fails with a broken pipe or connection reset error. If your pool does not have health checking and eviction configured, these errors surface to your users as unexpected query failures.
The fix is to configure maximum connection lifetime (the total time a connection can live before being replaced), maximum idle time (the time a connection can sit idle before being closed), and connection validation queries or TCP keepalive settings. HikariCP’s maxLifetime defaulting to 30 minutes is a reasonable baseline, but it should always be set to a value lower than the idle timeout enforced by your infrastructure layer. The only way to know that timeout value with certainty is to check your load balancer, RDS proxy, or NAT gateway configuration directly.
Not Accounting for Multiple Application Instances
A pool size of 20 looks modest for a single application instance. When you have ten instances running behind a load balancer, the database receives up to 200 simultaneous connection attempts. With autoscaling enabled, this number can grow unpredictably. Teams that tune pool size for a single instance and then scale horizontally without revisiting the pool configuration often discover the problem the first time their autoscaling group adds new instances under load, precisely when the system can least afford the extra database pressure.
The right mental model is to think about the total connection budget at the database level first, then divide it across application instances. If your PostgreSQL instance can safely handle 200 connections, and you run ten application instances, each instance gets a pool ceiling of 20 connections. If autoscaling can take you to 20 instances, each pool ceiling drops to 10. This calculation should be explicit in your configuration and revisited whenever your deployment topology changes.
Is Your Database Connection Pool Costing You Performance?
Common Pool Misconfiguration Patterns and Their Impact
| Misconfiguration | Symptom | Fix |
|---|---|---|
| Pool size too large | DB CPU and lock contention spike under load | Tune to (cores × 2) + 1, validate with load test |
| No connection lifetime limit | Broken pipe errors under sustained load | Set maxLifetime below infrastructure idle timeout |
| No idle eviction | Stale connections fail silently in production | Configure idle timeout and validation on borrow |
| Single instance sizing | Connection exhaustion when scaling out | Budget total DB connections, divide across instances |
| No acquire timeout | Requests hang indefinitely when pool exhausted | Set connection timeout, return 503 on pool exhaustion |
PgBouncer and the Case for an External Pooler
Application-level pooling solves the most obvious problem but has a hard constraint: each application process maintains its own pool, and those pools do not share connections with each other. In a microservices architecture with dozens of services all talking to the same PostgreSQL instance, the total connection count at the database scales with the number of services and their instance counts. This is where external poolers like PgBouncer become important.
PgBouncer sits as a lightweight proxy between applications and the database. Applications connect to PgBouncer as if it were the database itself, using standard PostgreSQL connection strings. PgBouncer maintains a much smaller pool of real database connections and multiplexes application connections onto them. The result is that a PostgreSQL instance that could not safely handle more than 200 connections can serve thousands of application-level connections through PgBouncer, because at any moment only a fraction of those application connections are executing a query. According to PgBouncer’s official documentation, the three pooling modes, session, transaction, and statement, offer different tradeoffs between compatibility and connection efficiency, with transaction pooling providing the best connection reuse for most OLTP workloads.
Transaction pooling is the most efficient mode but comes with constraints. Features that rely on session-level state such as advisory locks, prepared statements tied to sessions, and SET LOCAL configurations do not work correctly in transaction pooling mode because the connection returned to the pool after each transaction may be assigned to a different client on the next request. Teams migrating to PgBouncer in transaction mode often discover these compatibility issues the first time they enable the pooler in production. The correct approach is to audit application code for session-level state usage before switching pooling modes, not after.
PgBouncer Pooling Modes at a Glance
| Mode | How It Works | Best For |
|---|---|---|
| Session | One DB connection per client session | Legacy apps needing full session state |
| Transaction | DB connection held only during a transaction | Most modern OLTP applications |
| Statement | DB connection per SQL statement | Read-only workloads, very high concurrency |
Pool Exhaustion: What Happens and How to Handle It Gracefully
Pool exhaustion is the failure mode that most teams only truly understand after experiencing it in production. It occurs when all connections in the pool are checked out and a new request arrives needing a connection. Without a configured acquire timeout, that request blocks indefinitely, waiting for a connection to become available. In a web service handling hundreds of concurrent requests, this waiting request holds a thread or coroutine. Other requests also start waiting. Within seconds, all available threads are blocked waiting for pool connections, and the service stops accepting new requests entirely.
The correct behaviour under pool exhaustion is to fail fast with a meaningful error rather than block indefinitely. Set a connection acquire timeout that is short relative to your service’s request timeout, typically between 100 and 500 milliseconds for an API service. When the timeout is exceeded, the application should return an HTTP 503 or equivalent, indicating to the caller that the service is temporarily unavailable. This keeps request threads free, allows circuit breakers upstream to open, and prevents a pool exhaustion event from cascading into a full service hang.
Monitoring pool utilisation in production is essential for catching the early warning signs before exhaustion occurs. Track the number of active connections, the number of idle connections, the acquire wait time distribution, and the rate of acquire timeout errors. A pool that is consistently running at 80 percent utilisation is within one traffic spike of exhaustion. That observation should trigger a capacity planning conversation, not just an alert that gets silenced. For teams building observability into their backend stack more broadly, the same instrumentation discipline that applies to cloud and real-time database systems applies equally to relational connection management.
Is Your Database Connection Pool Costing You Performance?
Connection Pooling in Serverless and Containerised Environments
Serverless functions and containers introduce a distinct set of connection pooling challenges that do not exist in traditional long-running processes. A serverless function typically starts a fresh process for each invocation, which means each invocation opens a new database connection. With hundreds or thousands of concurrent function invocations, the connection count at the database can spike dramatically within seconds, overwhelming the connection limit of even a well-provisioned RDS instance.
The standard solution for serverless environments is to use a connection proxy that lives outside the function process. AWS RDS Proxy, Google Cloud SQL Auth Proxy, and self-managed PgBouncer deployments all serve this purpose. The proxy absorbs the burst of connections from Lambda or Cloud Run invocations and multiplexes them onto a stable pool of database connections. Without this layer, serverless applications that interact with relational databases are fundamentally fragile at scale, regardless of how well the rest of the application is engineered.
Container-based applications running on Kubernetes face a related challenge. Each pod maintains its own connection pool, and horizontal pod autoscaling events directly impact the total connection count at the database. A deployment that scales from 5 to 50 pods in response to a traffic event can increase connection count tenfold within a minute. Teams running Kubernetes workloads against PostgreSQL should consider a per-namespace or per-service PgBouncer deployment as a first-class architectural component rather than an afterthought. This principle is part of the broader engineering maturity thinking explored in Askan’s coverage of software development trends shaping backend architecture in 2025.
Connection Pooling Strategy by Deployment Context
| Environment | Recommended Approach |
|---|---|
| Single app server | Application-level pool, tune size to DB capacity |
| Multiple app instances | Application pool + enforce total connection budget |
| Microservices on Kubernetes | Sidecar or shared PgBouncer per service namespace |
| Serverless (Lambda, Cloud Run) | RDS Proxy or Cloud SQL Auth Proxy mandatory |
| High-concurrency read workloads | PgBouncer in transaction mode, read replicas |
Tuning in Practice: A Starting Framework
There is no universal correct pool configuration. The right values depend on your query duration distribution, your concurrency profile, your database server capacity, and your application’s tolerance for latency under load. What works is starting from a principled baseline and iterating with real data.
Begin by profiling your actual query latency at the 50th, 95th, and 99th percentiles under representative load. Shorter average query times mean each connection cycles through requests faster, which means a smaller pool serves the same throughput. If your p99 query time is 500 milliseconds, you need significantly fewer connections to serve 1000 requests per second than if your p99 is 5 seconds. This calculation should be explicit, not intuitive.
Set your maximum pool size conservatively, validate it under load, and monitor pool utilisation continuously after deployment. When utilisation regularly exceeds 70 percent, investigate whether the cause is query performance degradation, a traffic growth pattern, or a misconfigured client before simply raising the pool ceiling. Increasing pool size when the real problem is slow queries shifts the bottleneck to the database without resolving the underlying issue and often makes things worse.
Finally, treat connection pooling configuration as code. It should live in version control alongside your application configuration, it should be reviewed when deployment topology changes, and it should be part of your pre-launch checklist for any new service. The teams that get this right are not the ones with the most sophisticated pooling setup. They are the ones that thought carefully about the defaults they chose and tested them before going to production.
Most popular pages
-
Postgres vs MySQL in 2026: Which Fits Modern Application Workloads Better
Every couple of years the Postgres versus MySQL debate resurfaces, and 2026 is no different. Teams building new applications still ask the same question...
-
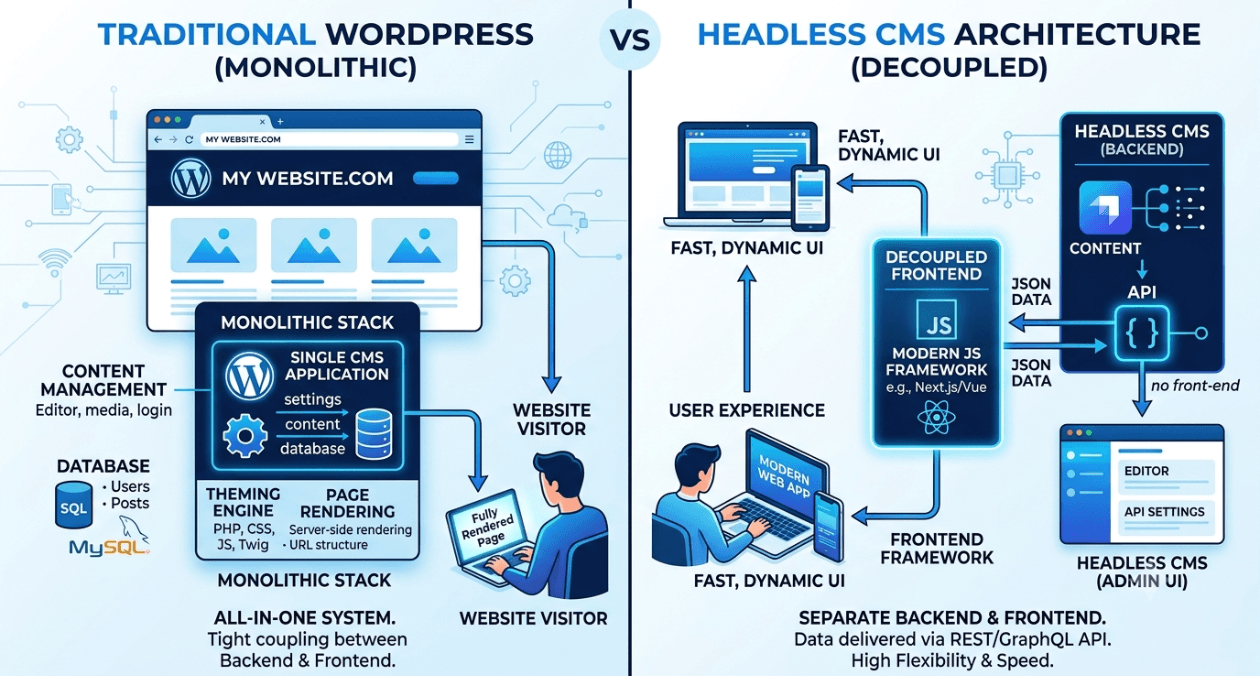
WordPress vs Headless WordPress: When Decoupling Actually Makes Sense
WordPress still runs a massive share of the web, and for good reason. It is fast to launch, familiar to content teams, and backed...
-
Prompt Injection and LLM Security: What Engineering Teams Must Defend Against
Every LLM powered feature shipped in the last two years shares one uncomfortable trait: the model reads instructions and data through the same channel....
Postgres vs MySQL in 2026: Which Fits Modern Application Workloads Better
Every couple of years the Postgres versus MySQL debate resurfaces, and 2026 is no different. Teams building new applications still ask the same question...
WordPress vs Headless WordPress: When Decoupling Actually Makes Sense
WordPress still runs a massive share of the web, and for good reason. It is fast to launch, familiar to content teams, and backed...
Prompt Injection and LLM Security: What Engineering Teams Must Defend Against
Every LLM powered feature shipped in the last two years shares one uncomfortable trait: the model reads instructions and data through the same channel....