


TABLE OF CONTENTS
Building Disaster Recovery Systems That Actually Work: RTO and RPO Strategies

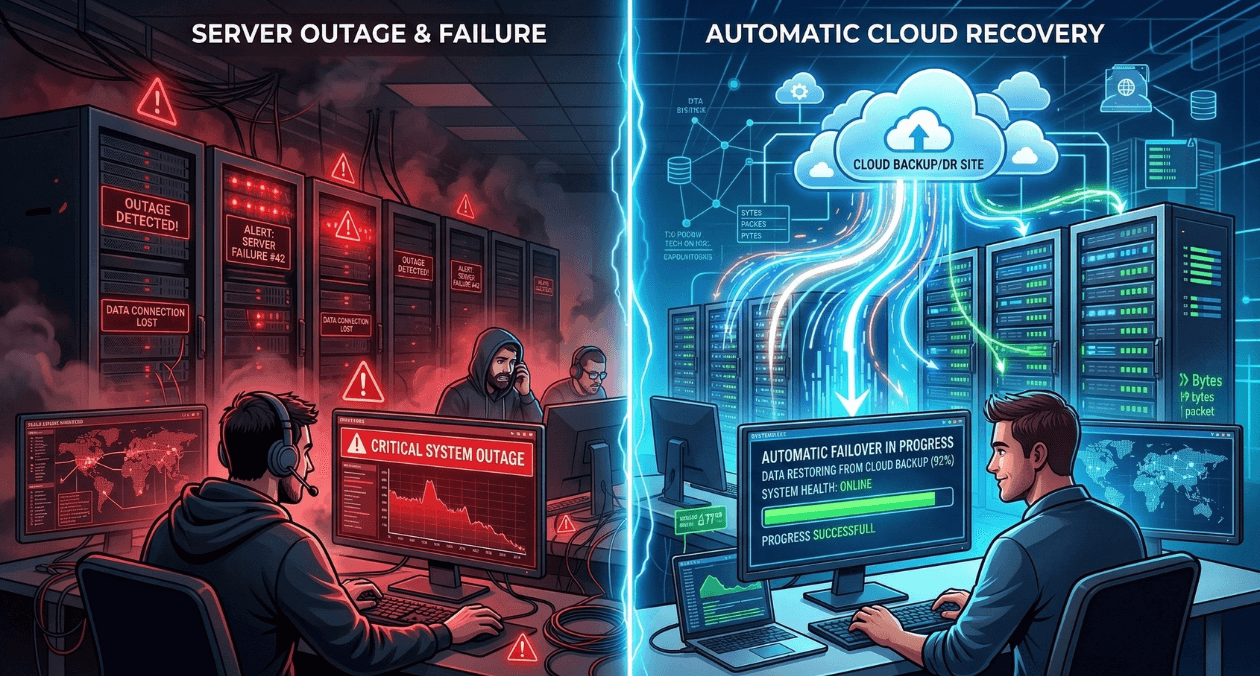
Disaster recovery is insurance you hope never to use. But when disasters strike (and they do), the difference between a good DR plan and a bad one is the difference between a 2-hour outage and a company-ending event.
The statistics are sobering: 60% of companies that experience catastrophic data loss shut down within six months. 93% of companies without disaster recovery that suffer major data disasters are out of business within one year. The average cost of downtime is $5,600 per minute in 2026, meaning a 24-hour outage costs $8 million.
Yet most organizations approach disaster recovery backward. They implement backup systems without understanding their actual recovery requirements. They purchase expensive solutions that don’t match their business needs. They build DR plans that look good on paper but fail spectacularly during real incidents.
For CTOs, infrastructure managers, and risk officers responsible for business continuity in 2026, the challenge isn’t just having a disaster recovery plan. It’s having a plan that actually works when needed, aligns with business requirements, and doesn’t waste money on unnecessary capabilities.
At Askan Technologies, we’ve designed and tested disaster recovery systems for 35+ enterprise clients over the past 24 months across industries including finance, healthcare, eCommerce, and SaaS, serving organizations in US, UK, Australia, and Canada with strict uptime and data retention requirements.
The data from real DR tests and actual incidents reveals a harsh truth: 70% of untested DR plans fail during actual disasters. But properly designed, tested, and maintained DR systems achieve 95%+ recovery success rates while costing 40-60% less than over-engineered solutions.
Understanding RTO and RPO: The Foundation
Before building DR systems, you must define your recovery objectives.
Recovery Time Objective (RTO)
What it is: Maximum acceptable downtime after disaster
Business question: “How long can our business survive without this system?”
Examples by system type:
| System | RTO | Business Impact |
| E-commerce checkout | 5 minutes | $50K+ revenue loss per hour |
| Email system | 4 hours | Communication disruption acceptable for hours |
| CRM database | 1 hour | Sales team blocked, deals delayed |
| Analytics dashboard | 24 hours | Reports can wait, no immediate impact |
| Payment processing | 0 minutes (HA required) | Every second of downtime = lost revenue + compliance risk |
Key insight: RTO isn’t technical. It’s a business decision based on revenue impact and customer tolerance.
Recovery Point Objective (RPO)
What it is: Maximum acceptable data loss measured in time
Business question: “How much data can we afford to lose?”
Examples by system type:
| System | RPO | Data Loss Tolerance |
| Financial transactions | 0 seconds | Zero tolerance (every transaction must be preserved) |
| Customer support tickets | 15 minutes | Last 15 min of tickets can be recreated from email |
| Marketing analytics | 24 hours | Yesterday’s metrics acceptable, not real-time critical |
| User uploads | 0 seconds | Customer data loss unacceptable |
| Application logs | 1 hour | Recent logs can be lost without business impact |
Key insight: Tighter RPO (less data loss) requires more expensive continuous replication. Looser RPO allows cheaper periodic backups.
The Cost Curve
DR costs increase exponentially as RTO and RPO approach zero.
Typical cost by requirement:
| RTO | RPO | DR Strategy | Annual Cost (for $500K infrastructure) |
| 24 hours | 24 hours | Daily backups to cloud storage | $5K-$10K |
| 4 hours | 1 hour | Hourly backups + warm standby | $25K-$50K |
| 1 hour | 15 minutes | Continuous replication + hot standby | $75K-$150K |
| 5 minutes | 0 seconds | Active-active multi-region | $200K-$400K |
Moving from 4-hour RTO to 1-hour RTO costs 3x more. Moving from 1 hour to 5 minutes costs another 3x.
Critical decision: Match DR investment to actual business requirements. Don’t pay for 5-minute RTO when 4 hours is acceptable.
The DR Strategy Spectrum
Different approaches provide different RTO/RPO capabilities at different costs.
Strategy 1: Backup and Restore (RTO: 12-24 hours, RPO: 6-24 hours)
What it is:
- Regular backups to cold storage (S3, Azure Blob)
- Restore from backup when disaster occurs
- Rebuild infrastructure from scratch
Process:
- Disaster occurs
- Assess damage and decide to failover
- Provision new infrastructure
- Restore data from latest backup
- Reconfigure applications
- Test and validate
- Resume operations
Timeline: 12-24 hours depending on data volume
Cost: Lowest (5-10% of infrastructure cost)
Pros:
- Cheapest option
- Simple to implement
- Works for non-critical systems
Cons:
- Slow recovery (hours to day)
- High data loss potential (24 hours of data)
- Manual process prone to errors
Best for:
- Internal tools
- Development/staging environments
- Analytics and reporting systems
- Non-revenue systems
Strategy 2: Pilot Light (RTO: 2-4 hours, RPO: 30-60 minutes)
What it is:
- Core infrastructure always running in DR site (database replicas)
- Application tier stopped (can be started quickly)
- Continuous or frequent data replication
Process:
- Disaster occurs
- Start application servers in DR site (10-15 minutes)
- Update DNS to point to DR site (5-10 minutes)
- Scale up to handle production traffic (20-30 minutes)
- Validate and monitor
Timeline: 2-4 hours including validation
Cost: Medium (15-30% of infrastructure cost)
Pros:
- Faster than backup/restore
- Data replicated continuously (low RPO)
- Reasonable cost
Cons:
- Still requires manual intervention
- Application tier cold start
- Testing requires bringing full environment up
Best for:
- Business-critical but not mission-critical systems
- E-commerce platforms (non-peak hours)
- SaaS applications with moderate uptime requirements
Strategy 3: Warm Standby (RTO: 30-60 minutes, RPO: 5-15 minutes)
What it is:
- Full environment running in DR site at reduced capacity
- Continuous data replication
- Can scale to full capacity quickly
Process:
- Disaster occurs
- Scale DR site to full capacity (5-10 minutes)
- Fail over traffic to DR site (5-10 minutes)
- Validate functionality (10-15 minutes)
- Monitor and adjust
Timeline: 30-60 minutes
Cost: High (40-60% of infrastructure cost)
Pros:
- Quick recovery (under 1 hour)
- Minimal data loss
- Can test DR regularly without disruption
Cons:
- Expensive (running duplicate infrastructure)
- Requires automated failover for speed
- Data synchronization complexity
Best for:
- Revenue-critical applications
- Customer-facing systems with SLA requirements
- Financial services platforms
- Healthcare applications
Strategy 4: Hot Standby / Active-Passive (RTO: 5-15 minutes, RPO: 0-5 minutes)
What it is:
- Full production environment running in DR site
- Real-time synchronous replication
- Immediate failover capability
Process:
- Disaster detected (automated monitoring)
- Automated failover triggered (1-2 minutes)
- Traffic redirected to DR site (2-3 minutes)
- Validation and monitoring
Timeline: 5-15 minutes (mostly automated)
Cost: Very high (80-100% of infrastructure cost)
Pros:
- Near-instant recovery
- Zero to minimal data loss
- Automated process (no manual steps)
Cons:
- Very expensive (double infrastructure)
- Complex to implement and maintain
- Synchronous replication impacts performance
Best for:
- Mission-critical systems
- Payment processing
- Trading platforms
- Systems with zero-tolerance downtime SLAs
Strategy 5: Active-Active Multi-Region (RTO: 0 seconds, RPO: 0 seconds)
What it is:
- Production traffic served from multiple regions simultaneously
- Both regions active and processing requests
- No failover needed (traffic automatically routes around failures)
Process:
- Disaster occurs in one region
- Load balancer stops routing to failed region (automatic, seconds)
- Remaining regions absorb traffic
- No user impact beyond brief latency spike
Timeline: 0 seconds (no downtime)
Cost: Highest (150-200% of infrastructure cost)
Pros:
- Zero downtime
- Zero data loss
- No failover process needed
- Regional redundancy built-in
Cons:
- Most expensive option
- Complex data consistency challenges
- Requires application design for multi-region
- Higher operational complexity
Best for:
- Global applications requiring 99.99%+ uptime
- Financial trading systems
- Critical infrastructure platforms
- Systems where any downtime = regulatory violation
Cost-Benefit Analysis Framework
How much should you spend on DR? Calculate the business case.
Calculate Your Downtime Cost
Formula: Cost per hour = (Revenue per hour) + (Recovery costs) + (Reputation damage)
Example: E-commerce platform
- Revenue: $50M annually = $5,700/hour
- Recovery costs: Emergency engineering @ $500/hour × 10 engineers = $5,000/hour
- Reputation damage: Customer churn, negative reviews (estimated 20% of revenue loss) = $1,140/hour
- Total: $11,840/hour
24-hour outage cost: $284,160
Calculate DR Investment
Annual DR cost for different strategies:
| Strategy | Annual Cost | RTO | Expected Annual Outage |
| Backup/Restore | $10K | 24 hours | 8 hours (pilot light warmup + restore) |
| Pilot Light | $50K | 4 hours | 4 hours total |
| Warm Standby | $120K | 1 hour | 1 hour total |
| Hot Standby | $200K | 15 minutes | 15 minutes total |
ROI Calculation
Scenario: Expecting one major disaster per 3 years
Option 1: Backup/Restore ($10K/year)
- Outage duration: 24 hours
- Cost of outage: $284K
- Amortized annual outage cost: $94.7K
- Total annual cost: $104.7K
Option 2: Warm Standby ($120K/year)
- Outage duration: 1 hour
- Cost of outage: $11.8K
- Amortized annual outage cost: $3.9K
- Total annual cost: $123.9K
Decision: Warm standby costs $19.2K more annually but provides 95% faster recovery. For revenue-critical application, the extra investment is justified.
Break-Even Analysis
When does investment in better DR pay off?
Formula: Break-even outage frequency = (Cost difference) / (Outage cost savings)
Example: Warm standby vs Backup/Restore
- Cost difference: $110K/year
- Outage cost savings per incident: $272K (24hr vs 1hr)
- Break-even: 0.4 outages per year
If you expect disaster more than once every 2.5 years, warm standby pays for itself.
Real Implementation: Financial Services Platform
Company Profile
Industry: Wealth management platform
Scale: $2.8B assets under management, 18,000 active users
Compliance: SEC, FINRA regulations require 4-hour RTO
Revenue impact: $250K/hour during market hours (estimated)
Previous DR setup:
- Daily database backups to S3
- No automated recovery process
- Infrastructure as code for rebuild
- Estimated RTO: 16-24 hours
- Estimated RPO: 24 hours
- Annual DR cost: $12K
Problems:
- RTO doesn’t meet compliance requirement (4 hours mandated)
- Never tested full recovery (just backup verification)
- Manual process prone to errors
- Revenue risk during recovery
New DR Architecture
Target requirements:
- RTO: 2 hours (50% better than compliance minimum)
- RPO: 15 minutes (acceptable data loss for this business)
- Annual budget: $150K maximum
- Must pass compliance audit
Implemented strategy: Pilot Light
Primary region (Production – AWS US-East-1):
- Application tier: Auto-scaling group (10-30 instances)
- Database: RDS PostgreSQL Multi-AZ (primary)
- Object storage: S3 with versioning
- Load balancer: Application Load Balancer
DR region (Pilot Light – AWS US-West-2):
- Application tier: Auto-scaling group (min 0, max 30) – scaled to zero normally
- Database: RDS Read Replica (continuous replication, 5-minute lag)
- Object storage: S3 Cross-Region Replication (real-time)
- Load balancer: Application Load Balancer (pre-configured)
Failover process:
- Detection (automated): CloudWatch alarms trigger if primary region unreachable for 3 minutes
- Notification: PagerDuty alerts on-call engineer + executive team
- Decision: On-call engineer assesses and approves failover (5 minutes)
- Promotion: Database read replica promoted to primary (automated, 2 minutes)
- Application start: Auto-scaling group in DR region scales to 10 instances (5 minutes)
- DNS update: Route 53 switches traffic to DR region (1 minute)
- Validation: Automated health checks verify system functional (3 minutes)
- Scale-up: Auto-scaling responds to traffic, scales to 30 instances as needed (10 minutes)
Total time: 26 minutes to basic service restoration, 36 minutes to full capacity
Implementation Process (12 Weeks)
Weeks 1-3: Design and approval
- Document RTO/RPO requirements
- Design DR architecture
- Calculate costs and get budget approval
- Create runbooks for failover procedures
Weeks 4-7: Infrastructure setup
- Provision DR region infrastructure (IaC with Terraform)
- Configure database replication
- Set up cross-region S3 replication
- Implement monitoring and alerting
Weeks 8-10: Automation development
- Write failover automation scripts
- Implement health checks and monitoring
- Create rollback procedures
- Document all processes
Weeks 11-12: Testing
- Tabletop exercise (talk through scenarios)
- Partial failover test (DR environment only, no production impact)
- Full failover test (during maintenance window)
- Chaos engineering (random component failures)
Results After 18 Months
Cost:
| Component | Annual Cost |
| DR region infrastructure (running) | $48,000 |
| Data replication (RDS, S3) | $18,000 |
| Cross-region data transfer | $12,000 |
| Monitoring and automation | $6,000 |
| Quarterly DR testing | $8,000 |
| Total | $92,000 |
Under budget: $58K remaining (38% under budget)
Testing results:
- 4 full DR drills conducted
- Average RTO achieved: 32 minutes (target: 2 hours, 73% better)
- Average RPO achieved: 8 minutes (target: 15 minutes, 47% better)
- Success rate: 100% (all tests successful)
Real incident (Month 14):
- AWS US-East-1 experienced regional outage (actual disaster)
- DR failover executed: 28 minutes to full service restoration
- Data loss: 6 minutes of transactions
- Customer impact: Minimal (brief service interruption during market hours)
- Revenue loss: $117K (vs $6M+ if 24-hour recovery)
Compliance:
- Passed SEC audit with distinction
- Auditors impressed by documented testing and actual incident performance
- RTO and RPO both exceed regulatory requirements
Business value:
- Avoided revenue loss: $5.9M (during actual incident)
- Avoided regulatory fines: Potential $1M+ for non-compliance
- Competitive advantage: Marketing now touts 99.99% uptime
- ROI: DR system paid for itself in single incident
DR Testing: The Critical Component
Most DR plans fail not because they’re poorly designed, but because they’re never tested.
Testing Frequency Guidelines
| System Criticality | Full DR Test Frequency | Partial Test Frequency |
| Mission-critical | Quarterly | Monthly |
| Business-critical | Semi-annually | Quarterly |
| Important | Annually | Semi-annually |
| Non-critical | As needed | Annually |
Types of DR Tests
- Tabletop Exercise (Cost: $2K-$5K)
- Team talks through disaster scenarios
- Identifies gaps in runbooks
- No actual infrastructure changes
- Time required: 2-4 hours
- Frequency: Quarterly
- Partial Failover Test (Cost: $5K-$10K)
- Test DR environment in isolation
- Don’t impact production
- Validate infrastructure, not traffic handling
- Time required: 4-8 hours
- Frequency: Quarterly
- Full Failover Test (Cost: $15K-$30K)
- Actually fail over production traffic
- Requires maintenance window
- Tests complete process end-to-end
- Time required: 6-12 hours (includes rollback)
- Frequency: Annually minimum
- Chaos Engineering (Cost: $20K-$50K for tools + time)
- Random failures injected continuously
- Validates automated recovery
- Builds confidence in systems
- Time required: Ongoing (automated)
- Frequency: Continuous
Common Testing Findings
From 35+ DR tests we’ve conducted:
Finding 1: Documentation outdated (65% of tests)
- Runbooks reference deleted resources
- IP addresses changed
- Access credentials expired
Solution: Auto-generate runbooks from infrastructure as code
Finding 2: Dependencies not understood (48% of tests)
- Third-party APIs fail in DR region
- Internal services not replicated
- Authentication systems region-locked
Solution: Dependency mapping and cross-region testing
Finding 3: Data inconsistency (32% of tests)
- Replication lag higher than expected
- Some data not replicated at all
- Corrupted data not detected
Solution: Automated data validation checks
Finding 4: Performance inadequate (28% of tests)
- DR region undersized for production load
- Network latency higher than expected
- Database too small
Solution: Load testing in DR environment
Finding 5: Recovery slower than documented (71% of tests)
- Manual steps take longer than estimated
- Automation fails or incomplete
- Coordination delays
Solution: Full automation, measured timings
Cloud Provider DR Capabilities
AWS
Native DR features:
- Multi-AZ deployments (automatic failover within region)
- Cross-region replication (RDS, S3, DynamoDB)
- Route 53 health checks and failover
- Backup services (automated snapshots)
Best practices:
- Use multiple availability zones for HA
- Use cross-region for DR
- Automate with CloudFormation/Terraform
Typical costs: 40-60% of primary region for warm standby
Azure
Native DR features:
- Availability Zones (within-region redundancy)
- Azure Site Recovery (automated DR orchestration)
- Geo-redundant storage (automatic replication)
- Traffic Manager (DNS-based failover)
Best practices:
- Use Availability Zones for HA
- Use paired regions for DR
- Azure Site Recovery for VMs
Typical costs: 35-55% of primary region for warm standby
Google Cloud
Native DR features:
- Regional persistent disks (within-region replication)
- Cloud SQL cross-region replicas
- Multi-regional Cloud Storage
- Cloud Load Balancing (global)
Best practices:
- Use regional resources for HA
- Use multi-region for DR
- Cloud Spanner for global consistency
Typical costs: 40-65% of primary region for warm standby
Multi-Cloud DR Strategy
Some organizations use different cloud providers for DR to avoid correlated failures.
Benefits
- Provider diversity: AWS outage doesn’t affect Azure DR site
- Negotiating leverage: Multi-cloud enables better pricing
- Regulatory compliance: Some industries require provider diversity
Challenges
- Complexity: Managing infrastructure across two providers
- Data transfer costs: Cross-cloud replication expensive ($0.02-$0.09/GB)
- Tooling: Separate monitoring, automation for each provider
- Expertise: Team needs skills in multiple clouds
When Multi-Cloud DR Makes Sense
- Large enterprises ($50M+ cloud spend) where added complexity justified
- Regulated industries requiring provider diversity
- Organizations already multi-cloud for other reasons
When Single-Cloud Better
- Startups and SMBs where simplicity matters
- Organizations under $10M cloud spend
- Teams without multi-cloud expertise
Recommendation: Use multi-region within single provider for most organizations. Multi-cloud only when specific requirements mandate it.
Key Takeaways
- 70% of untested DR plans fail during actual disasters regular testing is non-negotiable
- RTO and RPO are business decisions, not technical ones define based on revenue impact and compliance
- DR costs increase exponentially as requirements tighten 5-minute RTO costs 10-15x more than 4-hour RTO
- Pilot light strategy balances cost and capability 2-4 hour RTO at 15-30% of infrastructure cost
- Match DR investment to actual business needs don’t pay for 5-minute RTO when 4 hours is acceptable
- Testing frequency matters more than plan quality quarterly tests prevent 80% of failover failures
- Automation is critical for low RTO manual processes take 3-5x longer than documented
- Real incident validates DR investment one successful failover typically exceeds total DR costs
How Askan Technologies Builds DR Systems That Work
We’ve designed and tested disaster recovery systems for 35+ enterprises, achieving 95%+ success rates during actual disasters while optimizing costs 40-60% vs over-engineered solutions.
Our Disaster Recovery Services:
- RTO/RPO Analysis: Define recovery objectives based on business impact and compliance requirements
- DR Strategy Design: Architect appropriate solution matching technical and budget constraints
- Implementation: Deploy DR infrastructure with automation and monitoring
- Testing Programs: Establish regular testing cadence with documented procedures
- Compliance Support: Ensure DR meets regulatory requirements (SOC 2, HIPAA, PCI-DSS, FINRA)
- Incident Response: 24/7 support during actual disasters for failover execution
Recent DR Implementations:
- Financial platform: Pilot light strategy, 32-minute RTO (target 2 hours), saved $5.9M during real incident
- Healthcare SaaS: Warm standby, 45-minute RTO, passed HIPAA audit, 100% test success rate
- E-commerce platform: Active-passive hot standby, 8-minute RTO, zero customer impact during outages
We deliver disaster recovery systems with our 98% on-time delivery rate and guaranteed RTO/RPO achievement in testing.
Final Thoughts
Disaster recovery is the ultimate form of infrastructure insurance. You invest hoping never to use it, but when you need it, nothing else matters.
The organizations that survive disasters are those that treated DR as a business requirement, not an IT checkbox. They defined RTO and RPO based on actual revenue impact. They chose DR strategies matching their needs and budgets. They tested quarterly, not annually. They automated failover processes instead of relying on manual runbooks.
The companies that fail during disasters are those that built DR plans without testing them, chose strategies based on what seemed impressive rather than what they needed, or skipped DR entirely assuming it wouldn’t happen to them.
Don’t wait for disaster to discover your DR plan doesn’t work. Test it now. Validate your RTO and RPO assumptions. Automate your failover processes. Train your teams.
Every day without tested DR is a day one disaster away from catastrophic loss. One untested DR plan away from becoming the 60% of companies that shut down after major data loss.
Your disaster recovery investment isn’t a cost center. It’s business continuity insurance with measurable ROI calculated in disasters avoided, revenue preserved, and compliance maintained.
Build DR systems that actually work. Test them regularly. Trust them when disasters strike.
That’s how successful enterprises ensure business continuity in 2026.
Most popular pages
-
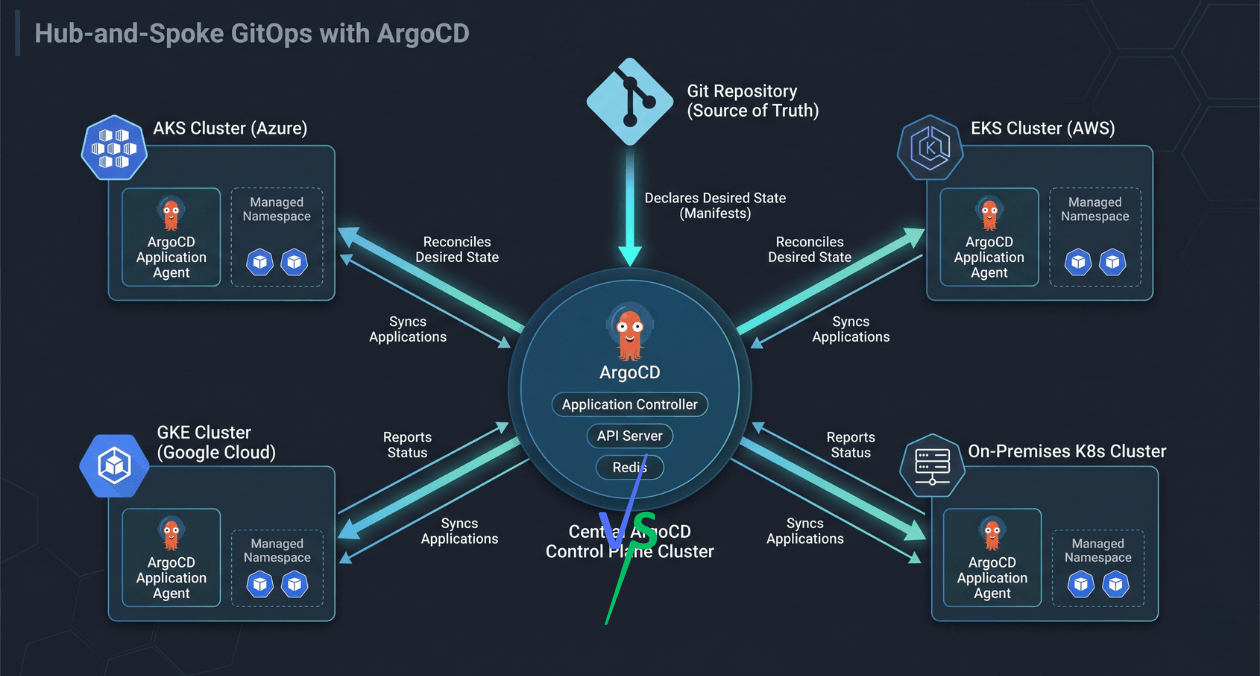
GitOps Beyond ArgoCD: Patterns That Scale for Large Engineering Organisations
ArgoCD became the default answer when someone said "GitOps" for a good few years. It solved the most common problem neatly: sync your Kubernetes...
-
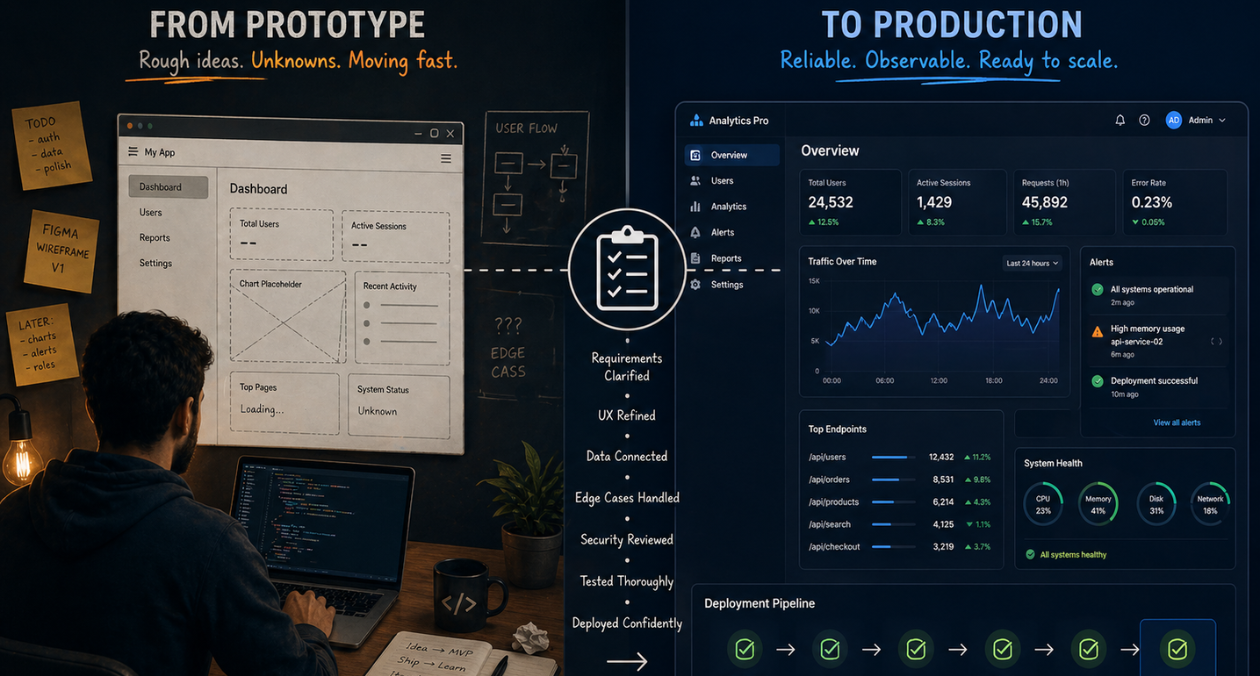
From Prototype to Production: The Engineering Checklist That Actually Matters
Prototypes lie. They perform well in demos because they are not doing any of the work that production systems actually do. There is no...
-
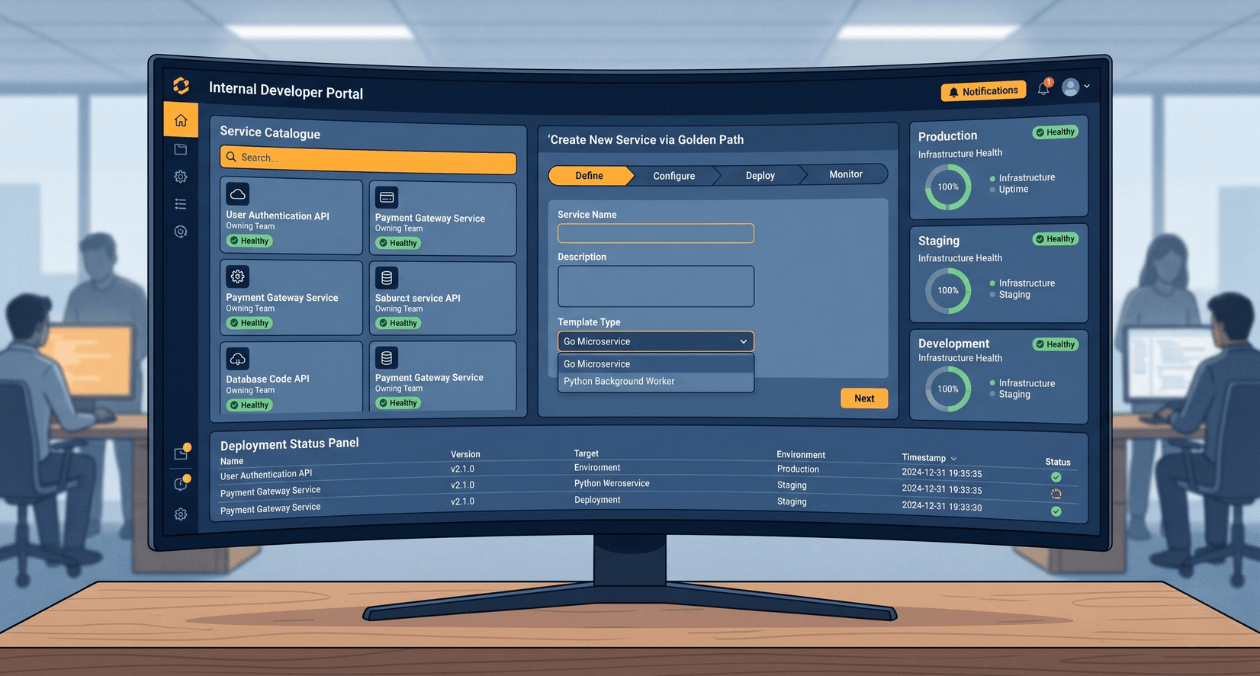
Building a Developer Experience (DX) Platform: From Golden Paths to Self-Service Infrastructure
There is a measurement problem at the heart of platform engineering. The people who benefit most from a well-built internal developer platform are often...
GitOps Beyond ArgoCD: Patterns That Scale for Large Engineering Organisations
ArgoCD became the default answer when someone said "GitOps" for a good few years. It solved the most common problem neatly: sync your Kubernetes...
From Prototype to Production: The Engineering Checklist That Actually Matters
Prototypes lie. They perform well in demos because they are not doing any of the work that production systems actually do. There is no...
Building a Developer Experience (DX) Platform: From Golden Paths to Self-Service Infrastructure
There is a measurement problem at the heart of platform engineering. The people who benefit most from a well-built internal developer platform are often...