


TABLE OF CONTENTS
CI/CD Pipeline Optimization: Reducing Build Times from 45 Minutes to 8 Minutes

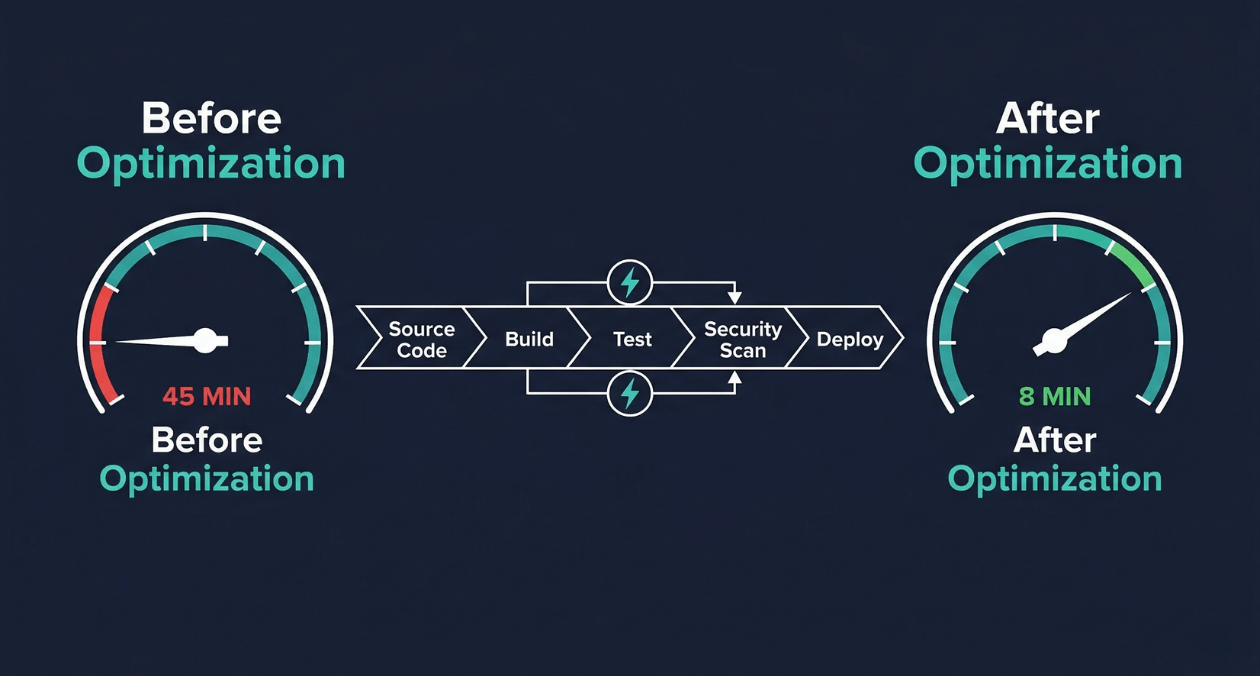
A 45-minute build pipeline is not just a productivity inconvenience. It is a structural constraint on how your engineering organization operates. When every commit waits 45 minutes for feedback, developers stop committing small changes and start batching work. Batched work produces larger diffs. Larger diffs introduce more risk per deployment. More risk per deployment leads to less frequent releases. Less frequent releases accumulate change until every deployment is a high-stakes event that the whole team dreads.
This is the slow pipeline trap, and it compounds quietly until the pain becomes undeniable. The good news is that CI/CD pipeline optimization is one of the highest-leverage engineering investments available. The techniques that compress a 45-minute pipeline to under 10 minutes are well-understood, tool-agnostic in their underlying principles, and produce returns that compound with every commit your team makes for years afterward.
This guide covers the diagnostic approach to identifying where your pipeline loses time, the optimization techniques that produce the largest gains, the caching and parallelization strategies that experienced build engineers rely on, and the tooling decisions that determine how far your pipeline can scale as your codebase grows.
Why Slow Pipelines Damage Engineering Organizations
The relationship between pipeline speed and developer productivity is not linear. Research published by the DORA team found that elite-performing organizations have lead times for changes measured in hours, not days. Pipeline speed is a direct input to that metric. When a pipeline takes 45 minutes, a developer who discovers their build failed cannot respond until they have already context-switched to a different task, loaded new mental state, and then been interrupted again by the failure notification.
Google’s internal research on developer productivity found that engineers value fast feedback loops above almost any other tooling improvement. A pipeline that returns results in under 10 minutes keeps the developer in flow. A pipeline that takes 45 minutes fragments the workday into waiting periods punctuated by reactive context-switching.
The organizational effects extend beyond individual productivity. Slow pipelines discourage test coverage growth because every new test increases build time and is perceived as adding to an already painful wait. Teams resist adding security scans, code quality gates, and integration tests for the same reason. The pipeline that should be a safety net becomes the bottleneck that people want to route around.
Diagnosing Where Your Pipeline Loses Time
Pipeline Stage Timing Analysis
You cannot optimize what you have not measured. The first step in any pipeline optimization project is producing a detailed timing breakdown of every stage in the current pipeline. Most CI platforms expose this data natively: GitHub Actions provides per-step timing in the workflow run view, GitLab CI shows per-job durations in the pipeline graph, and Jenkins exposes build timing through the Build Timeline plugin.
Record the median and 95th percentile duration for each stage across the last 30 days of pipeline runs. Median reflects the typical experience. The 95th percentile reveals the worst-case outliers that make developers uncertain about how long they will wait. Both numbers matter for understanding the real impact on team flow.
The Four Common Time Sinks
| Time Sink | What to Look For |
|---|---|
| Uncached dependency installation | npm install or pip install running fully on every pipeline run with no layer cache |
| Sequential test execution | All test suites running in a single process when they could be parallelized across runners |
| Monolithic Docker builds | Full image rebuild from scratch on every run because no layer caching is configured |
| Unnecessary test scope | All tests running on every commit regardless of which files changed |
A practical first pass is to add explicit timestamps at the start and end of each major stage and write the results to a structured log. Even without pipeline-native timing views, this gives you a consistent baseline across different CI environments and makes timing regressions visible in historical data.
Caching: The Highest-Impact Optimization
Dependency Caching
Dependency installation is almost always the largest avoidable time sink in a slow pipeline. A Node.js project with a moderately sized package.json can spend 6 to 12 minutes on npm install when run without a cache. With a properly configured cache keyed to the lockfile hash, that same step takes 15 to 30 seconds on a cache hit.
The cache key strategy is what determines cache hit rates. A cache key built from the hash of your lockfile (package-lock.json, yarn.lock, Pipfile.lock, go.sum) ensures that the cache is invalidated exactly when dependencies change and reused for every run where they have not changed. Keying the cache on a branch name or timestamp destroys hit rates because the cache is rarely reused between runs.
| Runtime | Cache Key Source | Cache Directory |
|---|---|---|
| Node.js (npm) | Hash of package-lock.json | ~/.npm or node_modules |
| Node.js (yarn) | Hash of yarn.lock | .yarn/cache |
| Python (pip) | Hash of requirements.txt | ~/.cache/pip |
| Go | Hash of go.sum | ~/go/pkg/mod |
| Java (Maven) | Hash of pom.xml | ~/.m2/repository |
| Rust (Cargo) | Hash of Cargo.lock | ~/.cargo/registry |
Docker Layer Caching
Docker image builds are a major pipeline bottleneck in containerized environments because every layer that invalidates forces a full rebuild of that layer and all subsequent layers. The Dockerfile layer ordering is the primary determinant of how much work gets cached between runs.
The rule is simple: put things that change infrequently near the top of the Dockerfile, and things that change on every commit near the bottom. Copying dependency manifest files (package.json, requirements.txt) and running the install command before copying application source code means the dependency layer is cached across every run where dependencies have not changed, regardless of what changed in your source files.
GitHub Actions supports Docker layer caching through the actions/cache action or through BuildKit’s registry-based cache export. GitLab CI provides built-in Docker layer caching through its container registry integration. Configuring these correctly can reduce a 6-minute Docker build to under 90 seconds on a warm cache.
BuildKit, Docker’s modern build engine, enables additional optimizations beyond layer caching. Its parallel stage execution processes independent Dockerfile stages simultaneously. Its mount cache feature caches package manager directories across builds without including them in the final image. Enabling BuildKit through the DOCKER_BUILDKIT=1 environment variable costs nothing and produces measurable build time reductions for most projects.
Test Result Caching and Change Detection
Running your full test suite on every commit is wasteful when most of those tests exercise code that was not touched by the commit. Change-based test selection uses the git diff between the current commit and the merge base to determine which source files changed, then runs only the tests that cover those files.
Tools like Jest’s –changedSince flag, Bazel’s incremental build system, and Nx’s affected computation implement this pattern. In a large monorepo where a single commit typically touches one or two packages out of fifty, change-based test selection can reduce the test execution scope by 90%, compressing a 20-minute full test run to under 3 minutes for the typical commit.
Audit Your CI/CD Pipeline for Hidden Time Sinks
Parallelization: Running Work Simultaneously
Job-Level Parallelization
The most impactful structural change in pipeline optimization is shifting from sequential job execution to parallel execution across independent stages. If your lint check, unit tests, and security scan are all independent of each other, they have no reason to run sequentially. Running them in parallel converts their combined sequential duration into the duration of the slowest job.
GitHub Actions expresses job-level parallelism through the needs keyword. Jobs that do not list a dependency in their needs field run simultaneously. GitLab CI uses the stages and needs keyword to achieve the same result, allowing jobs to run in parallel within a stage or even across stages when dependency relationships permit it.
| Stage | Sequential Duration | Parallel Duration |
|---|---|---|
| Lint + Unit Tests + Security Scan | 14 min (sequential) | 5 min (parallel, longest job) |
| Integration Tests (split across 4 runners) | 18 min (single runner) | 5 min (4-way parallel split) |
| Docker Build + Deploy Staging | 9 min (sequential) | 3 min (dependent, still sequential) |
| Total Pipeline | 45 min | 13 min with parallelization alone |
Test Suite Sharding
Test suite sharding splits your test files across multiple parallel runners, each executing a subset of the full suite. When your 1,200 test files take 18 minutes to run on a single runner, splitting them evenly across 4 runners reduces the bottleneck to under 5 minutes.
Effective sharding requires even distribution of work across shards. Naive alphabetical file splitting produces uneven shards when some test files are significantly heavier than others. Timing-based sharding, supported by tools like Cypress Cloud, CircleCI’s test splitting, and the jest-runner-groups package, distributes tests by their historical execution time rather than file count, balancing load across shards and maximizing parallelism efficiency.
Matrix Builds for Cross-Environment Testing
Matrix builds execute the same job configuration across multiple parameter combinations simultaneously. Common matrix dimensions include Node.js versions, operating systems, database versions, and browser environments. Testing against Node 20, Node 22, and Node 23 simultaneously, rather than sequentially, adds zero time to the pipeline despite tripling the test coverage surface.
GitHub Actions expresses matrix builds through the strategy.matrix key. GitLab CI uses the parallel:matrix keyword. Both platforms automatically generate and parallelize jobs for every combination of matrix parameters, allowing teams to maintain broad compatibility coverage without sacrificing pipeline speed.
Build Tool Selection and Configuration
Incremental Builds with Nx and Turborepo
Monorepo build tools like Nx and Turborepo implement computation caching and dependency graph-aware task execution that standard CI platforms cannot replicate. They analyze the dependency graph between packages in the monorepo and execute only the tasks that are affected by the current change, caching the outputs of all other tasks from previous runs.
| Tool | Caching Mechanism | Best Fit |
|---|---|---|
| Nx | Local + Nx Cloud distributed cache, task dependency graph | Angular/React monorepos, enterprise teams |
| Turborepo | Local + Remote cache (Vercel or self-hosted), pipeline config | Next.js and Node.js monorepos |
| Bazel | Hermetic builds, remote cache, distributed execution | Large polyglot monorepos at scale |
| Gradle Build Cache | Local and remote cache for Java/Kotlin/Android projects | JVM monorepos with complex dependency trees |
The remote cache is the feature that makes these tools transformative for CI environments. When Developer A runs a build on their laptop and the output is pushed to the remote cache, the CI runner for the next commit fetches that cached output rather than recomputing it. A build that was fully cached from a recent local run can complete in seconds on CI even for large codebases.
Compiler and Transpiler Optimization
TypeScript compilation is a common bottleneck in frontend and full-stack JavaScript projects. The TypeScript compiler’s –skipLibCheck flag skips type checking of declaration files in node_modules, often reducing compilation time by 20 to 40 percent with no impact on the correctness of your own code. The isolatedModules flag enables per-file transpilation that tools like esbuild and SWC can parallelize.
SWC, a Rust-based JavaScript and TypeScript compiler, compiles TypeScript 20 to 70 times faster than the native TypeScript compiler for the transpilation step (syntax transformation without type checking). Used in combination with tsc for type checking only (no emit), SWC handles the compilation output while TypeScript validates types as a separate parallel step. This separation eliminates the largest TypeScript build bottleneck without sacrificing type safety.
CI Platform Selection and Self-Hosted Runners
Managed vs. Self-Hosted Runners
Managed CI runners provided by GitHub Actions, GitLab CI, and CircleCI offer convenience but introduce two performance constraints: runner startup latency and fixed compute specifications. GitHub Actions’ ubuntu-latest runners take 30 to 60 seconds to boot from cold. For a pipeline with 8 parallel jobs, that startup overhead adds 30 to 60 seconds of pure waiting before any build work begins.
Self-hosted runners eliminate startup latency when configured to remain warm (pre-started and waiting for jobs rather than provisioned on demand). They also allow teams to choose compute specifications optimized for their workload: high-CPU instances for test parallelization, high-memory instances for large Docker builds, or ARM instances for ARM-targeted container builds that would require emulation on x86 managed runners.
| Runner Type | Startup Time | Cost Profile |
|---|---|---|
| GitHub hosted (ubuntu-latest) | 30-60 seconds per job | Per-minute billing, no infrastructure overhead |
| Self-hosted (on-demand) | 20-40 seconds | Infrastructure cost, operational overhead |
| Self-hosted (warm pool) | Under 5 seconds | Higher idle cost, maximum speed |
| Ephemeral Kubernetes runners | 15-30 seconds (pod startup) | Pay-per-use with cluster overhead |
Ephemeral Kubernetes Runners
Actions Runner Controller (ARC) for GitHub Actions and GitLab Runner on Kubernetes provide ephemeral runner pods that start for each job and terminate when it completes. This model provides the isolation benefits of fresh environments (no state leakage between runs) with the startup speed improvement of Kubernetes pod scheduling rather than full VM provisioning.
ARC supports runner scale sets that pre-provision a pool of warm pods ready to receive jobs immediately. Combined with Kubernetes cluster autoscaling, this creates a pipeline infrastructure that scales pod count with job queue depth, providing fast startup times during peak usage without paying for idle capacity during quiet periods.
Audit Your CI/CD Pipeline for Hidden Time Sinks
Security Scanning Without Sacrificing Speed
Security scanning is commonly identified as a pipeline bottleneck and then either removed or deprioritized when teams optimize for speed. This trade-off is false. Security tools can be integrated into fast pipelines without becoming the slowest stage, provided they are selected and configured appropriately.
Incremental and Targeted Scanning
Full dependency vulnerability scans and static analysis runs do not need to execute on every commit. A practical approach runs a comprehensive scan on the main branch merge and on pull requests that touch dependency files, while running a targeted scan limited to changed files on feature branch commits. This dramatically reduces scanning scope without leaving security gaps in the delivery pipeline.
| Scan Type | When to Run | Typical Duration |
|---|---|---|
| Dependency audit (npm audit, Snyk) | PRs touching package files + nightly on main | 30 to 90 seconds |
| SAST (Semgrep, CodeQL) | PR-level on changed files only | 1 to 4 minutes |
| Container image scan (Trivy, Grype) | After every Docker build | 30 to 120 seconds |
| Secret detection (gitleaks) | Every commit, pre-push hook | Under 30 seconds |
Semgrep’s –config flag limits static analysis to rules relevant to the languages and frameworks in the changed files. Trivy’s –ignore-unfixed flag skips vulnerabilities that have no available fix, reducing false-positive noise and scan output size. These configuration choices reduce scan time and improve signal quality simultaneously.
Pipeline Architecture for a Monorepo at Scale
Monorepo pipelines face a unique scaling challenge: the codebase grows continuously, but the pipeline should not grow proportionally slower. The architectural patterns that keep monorepo pipelines fast are distinct from the optimizations that work for single-package repositories.
Path-Based Trigger Filtering
Path-based trigger filtering runs specific jobs only when the files relevant to that job have changed. A commit that touches only the frontend package should not trigger the backend service’s integration tests. GitHub Actions implements path filtering through the paths key on workflow triggers. GitLab CI uses rules with changes conditions.
In a monorepo with 20 packages, path filtering alone can reduce the average number of jobs triggered per commit from 60 to 8, cutting pipeline execution time and compute costs by over 80 percent for the typical feature branch commit.
Pipeline-as-Code and Reusable Workflows
Reusable workflow definitions prevent pipeline configuration drift across packages and enable centralized optimization. In GitHub Actions, reusable workflows defined in a shared repository can be called by any workflow in the organization. When the caching configuration or runner specification is updated in the shared workflow, all consuming pipelines inherit the improvement automatically without manual updates across dozens of workflow files.
| Practice | Benefit |
|---|---|
| Reusable workflow templates | Single optimization applied to all pipelines in the organization |
| Workflow inputs and outputs | Parameterized pipelines that adapt to caller context without duplication |
| Composite actions | Multi-step logic packaged as a single reusable action reference |
| Centralized runner configuration | Runner specs updated once and inherited by all workflows |
Measuring Pipeline Health Over Time
Pipeline optimization is not a one-time project. Pipelines degrade over time as teams add tests, dependencies grow, and build configurations accumulate technical debt. Without ongoing measurement, a pipeline optimized to 8 minutes today can silently drift back toward 20 minutes six months later as the codebase evolves.
The metrics that matter for pipeline health are median and p95 pipeline duration per branch type (main branch vs. pull request), cache hit rate per stage, flaky test rate (tests that pass and fail without code changes), and pipeline failure rate by stage. These metrics should be tracked in a dashboard and reviewed monthly by the team or engineer responsible for build infrastructure.
GitHub provides pipeline metrics through the Actions API. Datadog’s CI Visibility product, CircleCI Insights, and GitLab’s CI/CD Analytics offer pre-built dashboards that track pipeline duration trends, failure rates, and queue time over time. Investing in pipeline observability creates the feedback loop that prevents gradual performance regression from going unnoticed.
The observability principles that apply to production systems apply equally to CI/CD infrastructure. Teams that instrument their pipelines with the same discipline they apply to production services, as described in our March 18 coverage of building observable systems, maintain fast pipelines consistently rather than rediscovering slowness after it has already damaged developer productivity.
The Complete Optimization Sequence: From 45 to 8 Minutes
The transformation from a 45-minute pipeline to an 8-minute pipeline is not the result of a single change. It is the cumulative effect of applying multiple optimizations in the right sequence. The following breakdown illustrates how each technique contributes to the final result based on the typical time profile of a medium-sized Node.js application with a full test suite and Docker-based deployment.
| Optimization Applied | Time Saved | Cumulative Duration |
|---|---|---|
| Starting point (no optimization) | Baseline | 45 minutes |
| Dependency cache (npm + lockfile hash key) | 7 minutes | 38 minutes |
| Docker layer cache (cache-friendly Dockerfile) | 5 minutes | 33 minutes |
| Job-level parallelization (lint + tests + scan) | 9 minutes | 24 minutes |
| Test suite sharding (4-way split) | 11 minutes | 13 minutes |
| Change-based test selection | 3 minutes | 10 minutes |
| Self-hosted warm runners (eliminated startup) | 1 minute | 9 minutes |
| SWC compilation replacing tsc emit | 1 minute | 8 minutes |
This sequence is intentional. Caching is applied first because it requires no architectural changes and delivers the largest single gain. Parallelization comes second because it requires structural changes to the pipeline configuration but builds on the caching layer to avoid redundant work across parallel jobs. Build tool optimization comes last because its gains, while real, are smaller than the structural changes that precede it.
The full-stack software delivery capabilities at Askan Technologies include CI/CD pipeline design, implementation, and optimization as part of a broader DevOps engineering practice that covers deployment architecture, infrastructure automation, and developer experience improvements across the entire software delivery lifecycle.
Common Mistakes That Undo Pipeline Optimizations
| Mistake | Effect | Prevention |
|---|---|---|
| Cache key too broad (branch name) | Cache never reused across PRs | Key on lockfile hash, not branch name |
| COPY . . before npm install in Dockerfile | Dependency layer rebuilds on every commit | Restructure Dockerfile: copy manifests first |
| All tests in single sequential job | No parallelism benefit, longest suite gates everything | Shard tests across parallel runners |
| Security scan on all files on every commit | Scan becomes pipeline bottleneck | Limit scope to changed files on feature commits |
| No pipeline duration tracking | Regressions go undetected for months | Dashboard tracking p50 and p95 duration weekly |
Audit Your CI/CD Pipeline for Hidden Time Sinks
Most popular pages
-
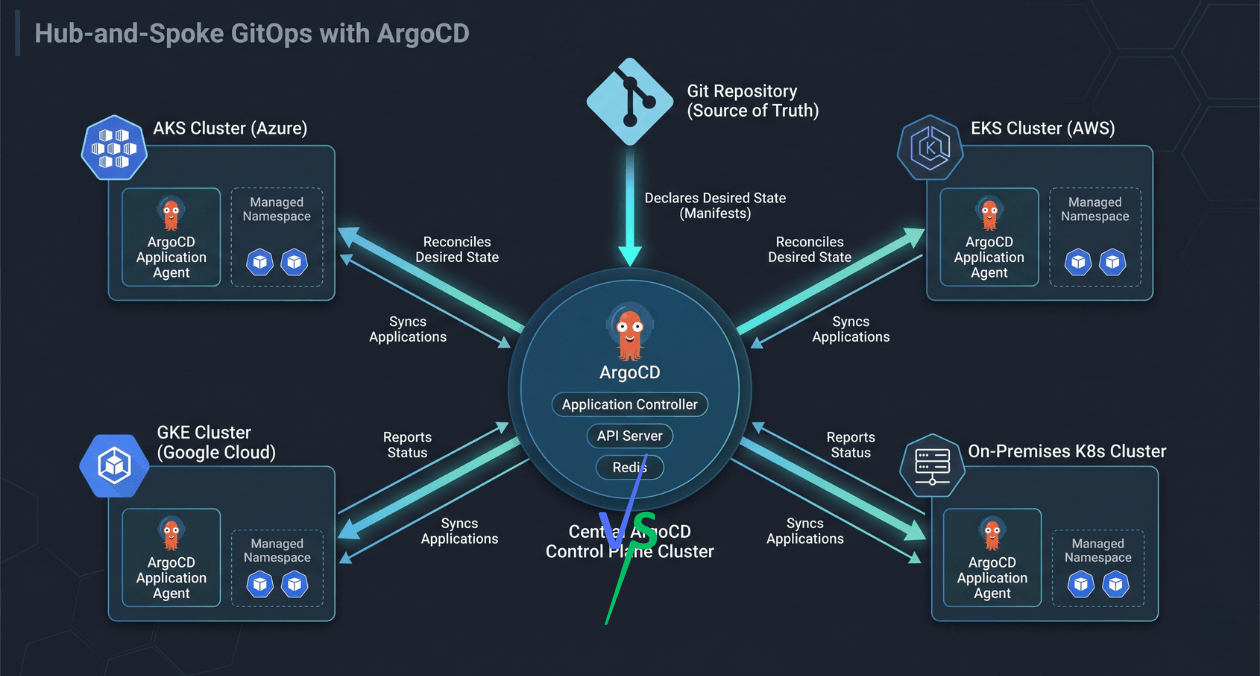
GitOps Beyond ArgoCD: Patterns That Scale for Large Engineering Organisations
ArgoCD became the default answer when someone said "GitOps" for a good few years. It solved the most common problem neatly: sync your Kubernetes...
-
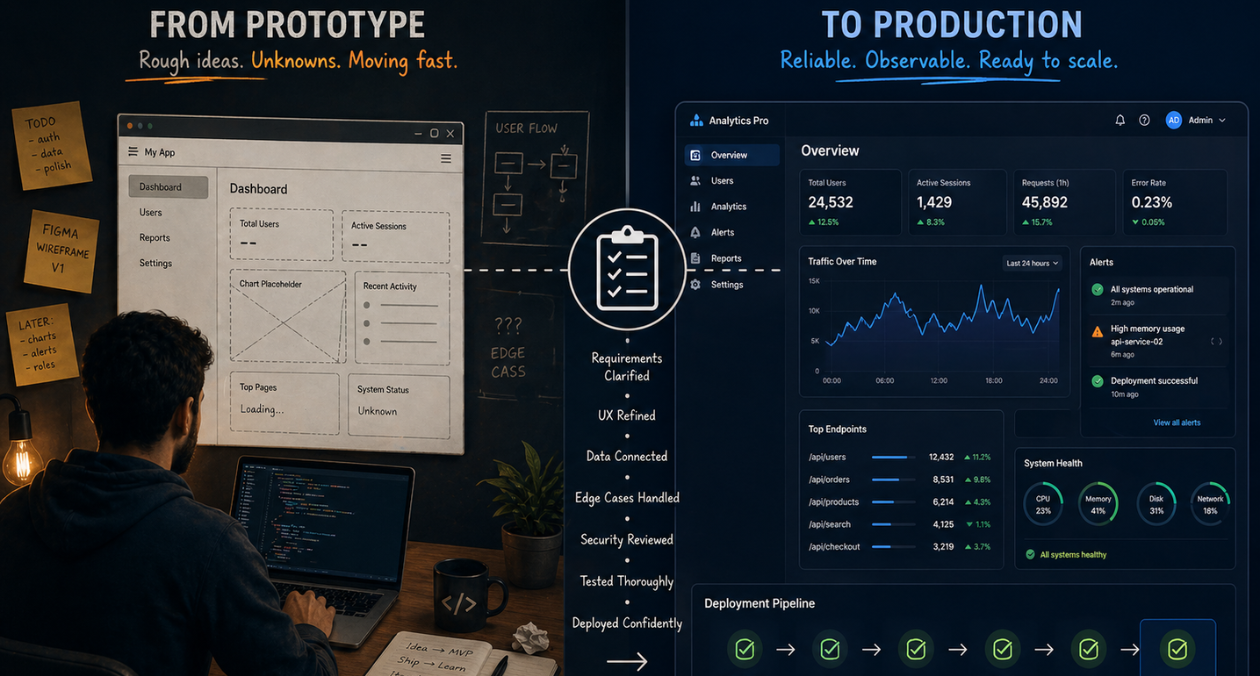
From Prototype to Production: The Engineering Checklist That Actually Matters
Prototypes lie. They perform well in demos because they are not doing any of the work that production systems actually do. There is no...
-
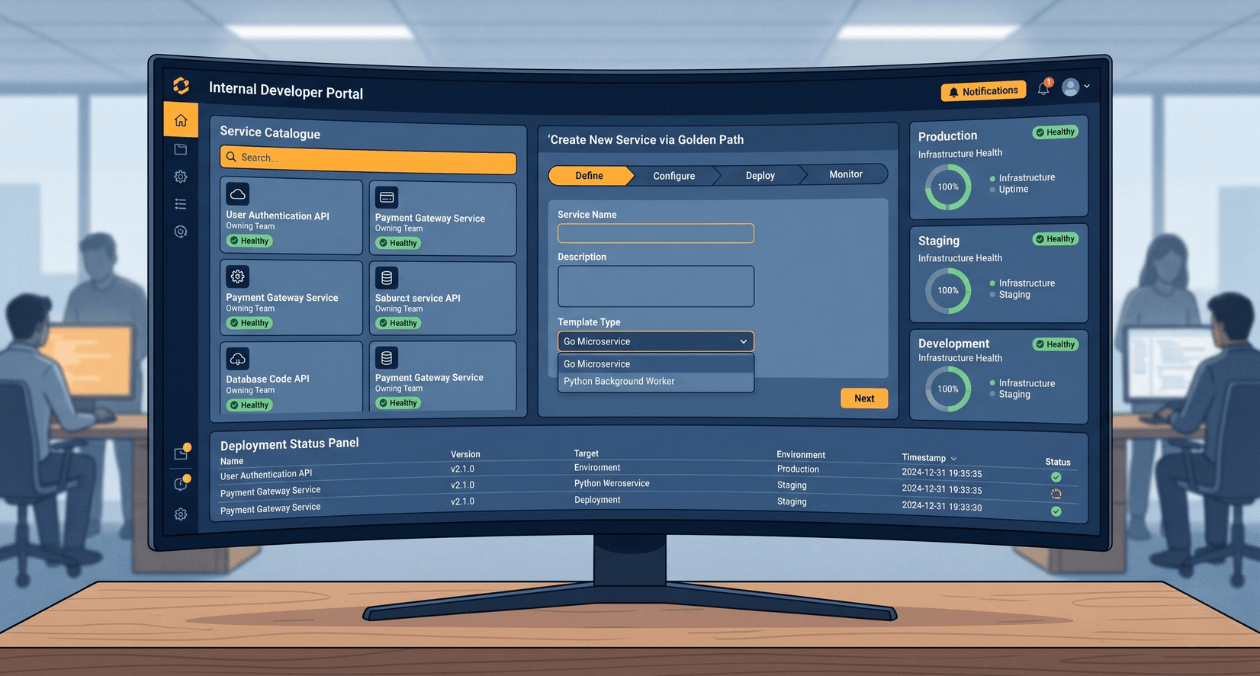
Building a Developer Experience (DX) Platform: From Golden Paths to Self-Service Infrastructure
There is a measurement problem at the heart of platform engineering. The people who benefit most from a well-built internal developer platform are often...
GitOps Beyond ArgoCD: Patterns That Scale for Large Engineering Organisations
ArgoCD became the default answer when someone said "GitOps" for a good few years. It solved the most common problem neatly: sync your Kubernetes...
From Prototype to Production: The Engineering Checklist That Actually Matters
Prototypes lie. They perform well in demos because they are not doing any of the work that production systems actually do. There is no...
Building a Developer Experience (DX) Platform: From Golden Paths to Self-Service Infrastructure
There is a measurement problem at the heart of platform engineering. The people who benefit most from a well-built internal developer platform are often...