


TABLE OF CONTENTS
AWS vs Azure vs Google Cloud: Total Cost of Ownership for Enterprise Workloads in 2026


Cloud infrastructure represents 15-40% of technology budgets for most enterprises in 2026. Yet the majority of organizations still make cloud provider decisions based on incomplete cost analysis, focusing on compute instance pricing while ignoring the dozens of other factors that determine true Total Cost of Ownership.
The consequence: companies migrate to the cloud expecting 30-50% cost savings and instead see costs balloon 20-80% above projections within 12 months. Not because cloud is expensive, but because they optimized for the wrong metrics.
For CTOs, CFOs, and infrastructure directors making or reconsidering cloud provider decisions in 2026, understanding Total Cost of Ownership across AWS, Azure, and Google Cloud is the difference between strategic advantage and budget disaster.
At Askan Technologies, we’ve managed cloud migrations and operations across all three major providers for 45+ enterprise clients over the past 24 months, serving organizations across US, UK, Australia, and Canada with workloads ranging from $50K to $2M annual cloud spend.
The data from real implementations reveals patterns the pricing calculators hide: actual TCO varies 40-60% between providers for identical workloads depending on architecture patterns, discount strategies, and operational costs. The cheapest provider on paper is rarely the cheapest in practice.
Why Compute Pricing Comparisons Are Misleading
Most cloud cost comparisons focus exclusively on virtual machine pricing. This creates a dangerous illusion.
The Compute Pricing Trap
Typical comparison approach:
- AWS m5.2xlarge: $0.384/hour
- Azure D8s v5: $0.384/hour
- Google Cloud n2-standard-8: $0.389/hour
Conclusion: “Prices are basically identical, choose any provider.”
Reality: Compute represents only 35-50% of total cloud costs for typical enterprise workloads.
The Hidden 50-65% of Cloud Costs
What enterprise workloads actually spend money on:
| Cost Category | Percentage of Total | Often Overlooked |
| Compute (VMs, containers) | 35-50% | No (always compared) |
| Data transfer / egress | 12-25% | Yes (massive variance) |
| Storage (object, block, database) | 10-18% | Partially (pricing complex) |
| Database managed services | 8-15% | Yes (different pricing models) |
| Load balancing / networking | 5-12% | Yes (hidden in infrastructure) |
| Monitoring / logging | 3-8% | Yes (scales with usage) |
| Support contracts | 3-10% | Sometimes (negotiable) |
| Licensing (Windows, databases) | 2-8% | Sometimes (BYOL options) |
TCO analysis must include all categories, not just compute.
Total Cost of Ownership Framework
True TCO includes infrastructure costs, operational overhead, and strategic considerations.
Category 1: Direct Infrastructure Costs
Compute pricing models:
AWS:
- On-Demand: Full price, no commitment
- Reserved Instances: 1-3 year commitment, 30-72% discount
- Savings Plans: Flexible commitment to dollar spend, 28-66% discount
- Spot Instances: Spare capacity, 50-90% discount (can be terminated)
Azure:
- Pay-as-you-go: Full price
- Reserved VM Instances: 1-3 year, 30-72% discount
- Azure Hybrid Benefit: Use existing Windows licenses (40% savings on Windows VMs)
- Spot VMs: 60-90% discount (evictable)
Google Cloud:
- On-Demand: Full price
- Committed Use Discounts: 1-3 year, 37-70% discount
- Sustained Use Discounts: Automatic discounts for consistent usage (no commitment needed)
- Preemptible VMs: 60-91% discount (24-hour max lifetime)
Key insight: Google Cloud’s automatic sustained use discounts (up to 30% for running instances consistently) are unique. AWS and Azure require commitment for similar savings.
Storage pricing comparison (per GB/month):
| Storage Type | AWS S3 | Azure Blob | Google Cloud Storage |
| Hot (frequent access) | $0.023 | $0.0184 | $0.020 |
| Cool (infrequent access) | $0.0125 | $0.010 | $0.010 |
| Archive (rarely accessed) | $0.004 | $0.002 | $0.0012 |
Pattern: Azure and Google Cloud consistently cheaper for storage, especially at cooler tiers.
Database managed services:
Pricing varies dramatically based on service choice:
Relational databases (PostgreSQL example, 8 vCPU, 32GB RAM):
- AWS RDS: $0.544/hour ($3,924/month)
- Azure Database: $0.532/hour ($3,833/month)
- Google Cloud SQL: $0.4576/hour ($3,300/month)
Google Cloud 16% cheaper for managed PostgreSQL at this tier.
NoSQL databases (DynamoDB vs Cosmos DB vs Firestore): Pricing models incomparable (request-based vs throughput-based). Must model specific workload.
Category 2: Data Transfer Costs (The Hidden Budget Killer)
Data egress (transferring data out of cloud) is where costs explode unexpectedly.
Egress pricing (per GB to internet):
| Provider | First 1GB | 1-10TB | 10-50TB | 50-150TB |
| AWS | Free | $0.09 | $0.085 | $0.07 |
| Azure | Free | $0.087 | $0.083 | $0.07 |
| Google Cloud | Free | $0.12 | $0.11 | $0.08 |
Google Cloud 25-40% more expensive for data egress.
Real-world impact:
Scenario: Video streaming platform serving 100TB monthly to end users
- AWS egress cost: $8,700/month
- Azure egress cost: $8,500/month
- Google Cloud egress cost: $11,700/month
Google Cloud costs $36,000 more annually just for data transfer.
When egress matters most:
- Video/media streaming platforms
- SaaS applications with large file downloads
- APIs serving external clients with high data volumes
- Backup services
- Content distribution
When egress matters less:
- Internal applications (no external data transfer)
- Data processing pipelines (data stays in cloud)
- Microservices within same region (no egress charges)
Category 3: Operational Costs
Cloud infrastructure requires ongoing management. Labor costs matter.
DevOps team productivity differences:
Based on our experience managing infrastructure across providers:
AWS:
- Largest ecosystem (most third-party tools)
- Steepest learning curve (700+ services)
- Best documentation and community support
- Most mature tooling (Terraform, automation)
Typical DevOps efficiency: 1 engineer manages $500K-$800K annual cloud spend
Azure:
- Strong integration with Microsoft ecosystem (Active Directory, Windows)
- Medium learning curve
- Good documentation
- Enterprise-friendly (familiar for Windows-heavy organizations)
Typical DevOps efficiency: 1 engineer manages $400K-$700K annual cloud spend
Google Cloud:
- Simpler, more focused service catalog
- Easiest learning curve
- Good but smaller community
- Excellent for data/ML workloads
Typical DevOps efficiency: 1 engineer manages $600K-$900K annual cloud spend
Operational cost calculation:
If DevOps engineer fully-loaded cost is $150K annually:
Managing $1M annual cloud spend:
- AWS: 1.25-2 engineers = $187K-$300K
- Azure: 1.4-2.5 engineers = $210K-$375K
- Google Cloud: 1.1-1.7 engineers = $165K-$255K
Google Cloud’s simplicity reduces operational overhead by $45K-$120K annually for $1M workload.
Category 4: Licensing and Support
Windows Server licensing:
AWS: Pay per hour (Windows included in instance price)
- Additional cost: 40% premium over Linux instances
Azure Hybrid Benefit: Use existing Windows Server licenses
- Savings: 40% on Windows VMs vs AWS
- Requirement: Software Assurance on Windows licenses
Google Cloud: Bring Your Own License (BYOL) or pay per use
- Similar to AWS pricing
For organizations with existing Microsoft Enterprise Agreements, Azure provides massive savings on Windows workloads.
Support contracts:
| Support Level | AWS | Azure | Google Cloud |
| Basic | Free | Free | Free |
| Developer | $29/month | $29/month | Free (basic support) |
| Business | 10% of monthly spend (min $100/month) | 10% of monthly spend | 4% of monthly spend |
| Enterprise | 10% of spend (min $15K/month) | 10% of spend | Custom pricing |
Google Cloud support costs 60% less for Business tier.
Support cost for $500K annual spend:
- AWS Business: $50K/year
- Azure Business: $50K/year
- Google Cloud Business: $20K/year
Savings with Google Cloud: $30K annually
Real TCO Analysis: Case Studies
Case Study 1: E-commerce Platform ($800K Annual Spend)
Workload profile:
- Web servers: 40 instances (compute-optimized)
- Database: PostgreSQL (32 vCPU, 128GB RAM)
- Storage: 50TB object storage (product images, videos)
- CDN: 200TB monthly egress
- Operating system: Linux
TCO Comparison:
| Cost Component | AWS | Azure | Google Cloud |
| Compute (reserved 3-year) | $245K | $242K | $218K |
| Database (RDS/managed) | $47K | $46K | $40K |
| Object storage | $13.8K | $11K | $12K |
| CDN egress | $174K | $170K | $234K |
| Load balancing | $18K | $15K | $12K |
| Monitoring/logging | $12K | $10K | $8K |
| Support (Business tier) | $51K | $50K | $21K |
| Total Annual TCO | $560.8K | $544K | $545K |
Winner: Azure (by $800) or Google Cloud (by $800)
Key insight: Despite Google Cloud’s cheaper compute and support, high CDN egress negates the advantage.
Strategic decision:
- Choose Azure or Google Cloud for compute savings
- Use Cloudflare CDN instead of native CDN (reduces egress costs 80%)
- With Cloudflare: Google Cloud becomes cheapest at $498K (11% savings vs AWS)
Case Study 2: SaaS Application ($1.2M Annual Spend)
Workload profile:
- Application servers: 80 instances (general purpose)
- Databases: Multiple PostgreSQL instances
- Storage: 15TB (mostly database)
- Data transfer: 50TB monthly (API responses)
- Operating system: Linux
- High availability required (multi-region)
TCO Comparison:
| Cost Component | AWS | Azure | Google Cloud |
| Compute (3-year reserved) | $520K | $515K | $465K |
| Databases (managed) | $185K | $182K | $165K |
| Storage | $8.5K | $7K | $7.2K |
| Data egress | $36K | $35K | $48K |
| Load balancing | $32K | $28K | $24K |
| Multi-region replication | $45K | $42K | $38K |
| Monitoring/logging | $22K | $18K | $15K |
| Support (Business) | $85K | $83K | $34K |
| Total Annual TCO | $933.5K | $910K | $796.2K |
Winner: Google Cloud (saves $137K annually, 15% cheaper than AWS)
Why Google Cloud wins:
- Sustained use discounts reduce compute costs automatically
- Cheaper support (60% less than AWS/Azure)
- Lower multi-region replication costs
- Data egress only 50TB (not enough to negate other savings)
Case Study 3: Windows-Heavy Enterprise ($600K Annual Spend)
Workload profile:
- Windows servers: 50 instances (Active Directory, .NET applications)
- SQL Server databases: 4 large instances
- Existing Microsoft Enterprise Agreement with Software Assurance
- Storage: 20TB
- Minimal external data transfer
TCO Comparison:
| Cost Component | AWS | Azure | Google Cloud |
| Windows compute (3-year) | $385K | $231K (Hybrid Benefit) | $370K |
| SQL Server managed | $165K | $98K (license included) | $158K |
| Storage | $11K | $9K | $9.5K |
| Data egress | $8K | $7.5K | $10K |
| Active Directory integration | $12K | $0 (native) | $15K |
| Support (Business) | $58K | $35K | $23K |
| Total Annual TCO | $639K | $380.5K | $585.5K |
Winner: Azure (saves $258.5K annually, 40% cheaper than AWS)
Why Azure dominates:
- Azure Hybrid Benefit saves 40% on Windows licensing
- SQL Server licensing included in managed service (AWS charges separately)
- Native Active Directory integration (no additional setup costs)
- Seamless experience for Windows-centric IT teams
Strategic insight: For Microsoft-heavy shops with Enterprise Agreements, Azure is dramatically cheaper.
The Multi-Cloud Strategy Consideration
Many enterprises adopt multi-cloud to avoid vendor lock-in or optimize costs per workload.
Multi-Cloud Benefits
Cost optimization:
- Run compute-heavy workloads on cheapest provider (often Google Cloud)
- Run Windows workloads on Azure (Hybrid Benefit)
- Use best-of-breed services (AWS RDS, Google Cloud BigQuery, Azure Active Directory)
Vendor leverage:
- Negotiate better pricing (credible threat to move workloads)
- Avoid single vendor dependency
Risk mitigation:
- Outages affect single provider, not entire infrastructure
- Regulatory requirements (data residency in different regions)
Multi-Cloud Costs
Added complexity:
- Multiple tools and processes (Terraform still helps but more complex)
- Cross-cloud data transfer expensive (egress charges both directions)
- Multiple support contracts
- Larger DevOps team required (expertise across providers)
Operational overhead estimation:
Single cloud: 1 engineer per $600K spend = $150K labor for $600K infrastructure
Multi-cloud (2 providers): 1.5-2 engineers per $600K total spend = $225K-$300K labor
Added cost: $75K-$150K annually in operational overhead
When Multi-Cloud Makes Sense
- Large enterprises ($5M+ cloud spend) where efficiency gains outweigh added complexity
- Specific regulatory requirements forcing data in different regions/providers
- Existing Microsoft Enterprise Agreement (use Azure for Windows, AWS/GCP for Linux)
- ML/data workloads where Google Cloud’s AI Platform or BigQuery are superior
- When Single Cloud Better
- Startups and SMBs (under $1M spend) where simplicity matters more than optimization
- Limited DevOps resources (small teams can’t manage multiple platforms effectively)
- Homogeneous workloads (all Linux or all Windows) where one provider optimizes easily
TCO Optimization Strategies
Strategy 1: Right-Sizing Instances
Most common waste: Over-provisioned instances running at 20-30% utilization.
Optimization approach:
- Monitor CPU/memory usage for 30 days
- Right-size to actual needs (downsize 40-60% of instances)
- Typical savings: 30-45% of compute costs
Example:
- Current: 100x m5.2xlarge instances at 25% utilization = $276K/year
- Optimized: 60x m5.large instances + 40x m5.xlarge = $172K/year
- Savings: $104K annually (38%)
Strategy 2: Reserved Instance / Committed Use Strategy
Avoid: Buying 3-year reservations for workloads that might change
Better approach:
- 1-year reservations for 60% of predictable baseline capacity (safe bet)
- 3-year reservations for 30% of absolutely stable workload (maximum discount)
- On-demand for remaining 10% (flexibility for growth and experimentation)
Typical discount achieved: 45-55% vs all on-demand (vs 30% with poor strategy)
Strategy 3: Spot/Preemptible for Appropriate Workloads
Good candidates for spot instances:
- Batch processing jobs
- CI/CD build servers
- Data analysis pipelines
- Rendering workloads
- Development/testing environments
Bad candidates:
- Production web servers (user-facing)
- Databases (stateful, can’t tolerate interruption)
- Real-time processing (latency-sensitive)
Savings: 60-90% on appropriate workloads
Best practice: Mix spot and on-demand (70% spot, 30% on-demand for fault tolerance)
Strategy 4: Storage Tiering
Most common waste: Keeping all data in hot storage indefinitely
Optimization:
- Lifecycle policies moving data to cooler tiers automatically
- Hot storage: 0-30 days (frequent access)
- Cool storage: 30-90 days (occasional access)
- Archive storage: 90+ days (rarely accessed)
Typical savings: 60-80% on storage costs for data older than 90 days
Strategy 5: CDN for Egress Reduction
For high-egress workloads (100TB+ monthly):
Without CDN:
- Cloud provider egress: $0.09/GB = $9,000 per 100TB
With CDN (Cloudflare, Fastly, Akamai):
- CDN cost: $0.02-$0.04/GB = $2,000-$4,000 per 100TB
- Savings: $5,000-$7,000 monthly ($60K-$84K annually)
Decision Framework: Choosing Your Cloud Provider
Choose AWS If:
- Largest service catalog needed (700+ services vs 200-300 for others)
- Mature ecosystem critical (most third-party tools, largest talent pool)
- Complex, varied workloads (different teams needing different specialized services)
- Willing to invest in optimization (most complex, but most powerful when optimized)
- Not heavily Windows-based (licensing costs higher than Azure)
Typical fit: Large enterprises with complex needs, startups needing cutting-edge services, companies prioritizing innovation over cost
Choose Azure If:
- Microsoft-heavy environment (Windows, Active Directory, SQL Server, .NET)
- Existing Microsoft Enterprise Agreement (Hybrid Benefit provides massive savings)
- Hybrid cloud strategy (Azure Arc for on-premises integration best-in-class)
- Enterprise compliance familiarity (many enterprises already trust Microsoft)
Typical fit: Enterprises with Microsoft ecosystem, organizations requiring hybrid cloud, Windows-centric IT departments
Choose Google Cloud If:
- Data and ML workloads (BigQuery, AI Platform, TensorFlow best-in-class)
- Simplicity valued (fewer services, easier learning curve)
- Cost optimization priority (sustained use discounts automatic, cheaper support)
- Kubernetes-native (GKE best Kubernetes experience, Google created K8s)
- Lower egress requirements (egress more expensive, but other costs lower)
Typical fit: Startups prioritizing cost efficiency, data-heavy companies, Kubernetes-first architectures, ML-focused organizations
Multi-Cloud If:
- $5M+ annual cloud spend (complexity overhead justified)
- Diverse workloads (Windows on Azure, data on GCP, compute on AWS)
- Regulatory requirements (data residency across regions/providers)
- Strong DevOps team (expertise to manage multiple platforms)
Key Takeaways
- True TCO includes 8+ cost categories not just compute pricing (egress, storage, support, operations)
- Actual costs vary 40-60% between providers for identical workloads depending on profile
- Azure wins for Windows workloads by 30-40% with Hybrid Benefit and license inclusion
- Google Cloud wins for Linux/data workloads by 10-20% with sustained discounts and cheaper support
- AWS provides most services and maturity but requires most optimization effort for cost efficiency
- Data egress costs can swing decisions 100TB+ monthly transfer makes Google Cloud 15-25% more expensive
- Operational costs matter simpler platforms (Google Cloud) reduce DevOps overhead $50K-$100K annually
- Multi-cloud adds 25-50% operational overhead only justified for large enterprises ($5M+ spend)
How Askan Technologies Optimizes Cloud TCO
We’ve managed cloud infrastructure optimization across AWS, Azure, and Google Cloud for 45+ clients, delivering 25-45% cost reductions while improving performance.
Our Cloud TCO Optimization Services:
- TCO Analysis: Comprehensive cost modeling across all three providers for your specific workload
- Right-Sizing Assessment: Identify over-provisioned resources and optimization opportunities
- Multi-Cloud Strategy: Design optimal provider mix for diverse workloads
- Migration Planning: Move workloads between providers to optimize costs
- Reserved Capacity Strategy: Maximize discount programs while maintaining flexibility
- Ongoing Optimization: Quarterly reviews ensuring costs stay optimized as workloads evolve
Recent TCO Optimizations:
- E-commerce platform: Migrated to multi-cloud (Azure for Windows, GCP for data), saved $137K annually (17%)
- SaaS application: Google Cloud migration with CDN optimization, saved $215K annually (23%)
- Enterprise Windows shop: Azure Hybrid Benefit implementation, saved $258K annually (40%)
We deliver cloud cost optimization with our 98% on-time delivery rate and guaranteed savings targets.
Final Thoughts
Cloud provider decisions based solely on compute pricing comparisons miss 50-65% of actual costs. Enterprises making decisions without comprehensive TCO analysis consistently overspend by 20-50% within 12 months of migration.
The cheapest provider for one workload is the most expensive for another. Windows workloads favor Azure (30-40% cheaper with Hybrid Benefit). Data-heavy Linux workloads favor Google Cloud (15-20% cheaper with sustained discounts). Complex, service-diverse workloads may justify AWS despite higher costs.
The winning strategy: model your specific workload across all three providers including compute, egress, storage, database, support, and operational costs. The total cost difference often exceeds $100K annually for $500K infrastructure spend.
Don’t let cloud costs spiral out of control because you optimized for the wrong metrics. Analyze total cost of ownership comprehensively. Choose strategically based on your workload profile. Optimize continuously as workloads evolve.
Your cloud provider choice isn’t just a technology decision. It’s a $500K to $5M annual budget decision that compounds over years. Choose based on complete TCO analysis, not marketing claims or compute pricing alone.
Build on the most cost-effective foundation for your specific needs. That’s how smart enterprises maximize cloud ROI in 2026.
Most popular pages
-
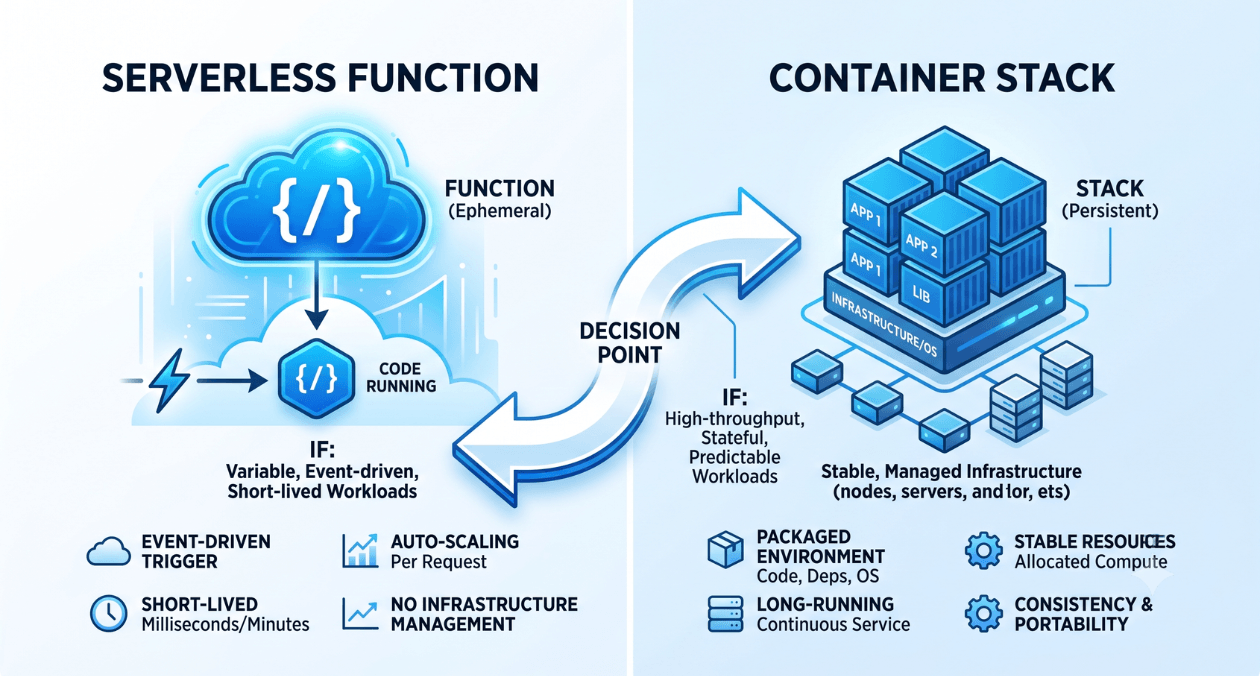
Serverless vs Containers: Choosing the Right Compute Model for Your Workload
Every engineering team building on the cloud eventually runs into this question: should this workload run on serverless functions or inside containers. The answer...
-

Postgres vs MySQL in 2026: Which Fits Modern Application Workloads Better
Every couple of years the Postgres versus MySQL debate resurfaces, and 2026 is no different. Teams building new applications still ask the same question...
-
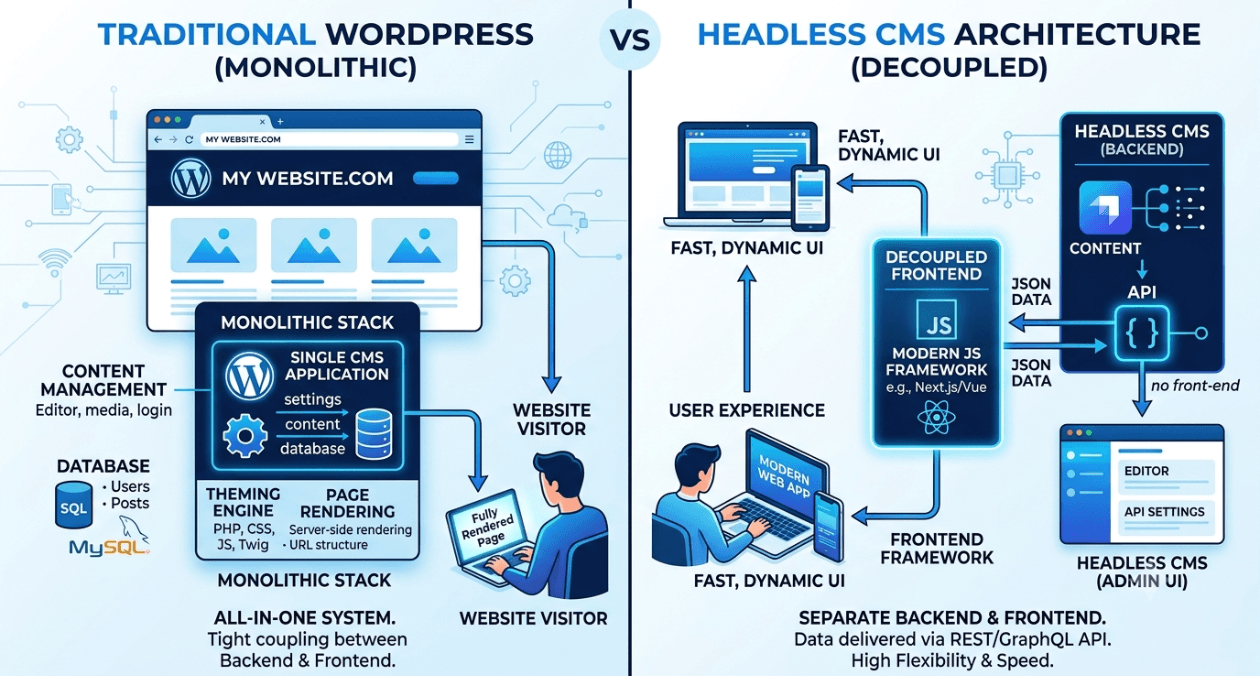
WordPress vs Headless WordPress: When Decoupling Actually Makes Sense
WordPress still runs a massive share of the web, and for good reason. It is fast to launch, familiar to content teams, and backed...
Serverless vs Containers: Choosing the Right Compute Model for Your Workload
Every engineering team building on the cloud eventually runs into this question: should this workload run on serverless functions or inside containers. The answer...
Postgres vs MySQL in 2026: Which Fits Modern Application Workloads Better
Every couple of years the Postgres versus MySQL debate resurfaces, and 2026 is no different. Teams building new applications still ask the same question...
WordPress vs Headless WordPress: When Decoupling Actually Makes Sense
WordPress still runs a massive share of the web, and for good reason. It is fast to launch, familiar to content teams, and backed...