

TABLE OF CONTENTS
Building a $10M Revenue eCommerce Platform: Tech Stack Decisions That Matter


Building a $10M Revenue eCommerce Platform: Tech Stack Decisions That Matter
The path from startup to $10M in eCommerce revenue is paved with critical technology decisions. Choose the right stack, and you build a foundation that scales effortlessly as revenue grows. Choose wrong, and you hit performance walls, suffer site crashes, and spend six figures on emergency rebuilds.
For founders and CTOs at growth-stage eCommerce companies (currently doing $1M to $5M, targeting $10M+), the technology stack decision isn’t just about what works today. It’s about what will still work when traffic is 10x higher, when your catalog has 50K SKUs instead of 5K, and when peak sales days generate $500K in a few hours.
At Askan Technologies, we’ve architected and built eCommerce platforms for companies scaling from $2M to $20M+ in revenue. These aren’t portfolio projects or MVPs. We’re talking about production systems handling millions in transactions, processing thousands of orders daily, and operating across US, UK, Australia, and Canada markets where downtime costs thousands per minute.
The patterns are clear: certain technology choices consistently enable growth, while others become bottlenecks that require expensive rewrites just when scaling momentum matters most.
This guide reveals the architectural decisions that differentiate $10M revenue platforms from those that struggle to break $3M.
The $10M Revenue Reality: What Your Platform Must Handle
Before diving into technology choices, let’s quantify what a $10M revenue eCommerce platform actually faces.
Traffic and Transaction Volume
Monthly metrics at $10M annual revenue:
| Metric | Conservative | Aggressive |
| Monthly visitors | 150K | 400K |
| Monthly orders | 4,200 | 8,300 |
| Average order value | $200 | $100 |
| Peak day traffic | 15K visitors | 40K visitors |
| Concurrent users (peak) | 500-800 | 1,200-2,000 |
| Catalog size | 5K-15K SKUs | 20K-50K SKUs |
Performance requirements:
- Page load time: Under 2 seconds (Google penalties above this)
- Checkout completion: Under 30 seconds end-to-end
- Search results: Under 500ms response time
- API response time: Under 200ms for product data
- Uptime: 99.9% minimum (43 minutes downtime per month maximum)
Cost of downtime:
At $10M revenue with 99% uptime, one hour of downtime during peak shopping (Black Friday, holiday season) costs $8K to $12K in lost sales. Plus reputation damage, increased customer support costs, and potential penalty fees from payment processors.
Seasonal Spike Handling
$10M revenue platforms face dramatic seasonal variation:
| Season | Revenue Multiple | Traffic Multiple | Tech Challenge |
| Q1 (Jan-Mar) | 0.8x baseline | 1.0x | Cost efficiency during low periods |
| Q2 (Apr-Jun) | 1.0x baseline | 1.2x | Steady state operations |
| Q3 (Jul-Sep) | 1.1x baseline | 1.3x | Back-to-school prep |
| Q4 (Oct-Dec) | 2.5x baseline | 4.0x | Black Friday, holiday crush |
Black Friday reality: A platform doing $10M annually might generate $800K in revenue during a single weekend. That’s 8-10x normal traffic, all expecting instant page loads and smooth checkout.
Your technology stack must handle this spike without manual scaling interventions at 2am on Thanksgiving night.
The Architecture Framework: Non-Negotiable Components
Every $10M revenue platform needs these architectural layers, regardless of specific technology choices:
Layer 1: Frontend Presentation
What it does: Displays products, handles user interactions, renders checkout flow.
Performance requirements:
- Time to Interactive: Under 3 seconds
- Largest Contentful Paint: Under 2.5 seconds
- Core Web Vitals: All metrics in “good” range (Google ranking factor)
Technology options (covered in detail below):
- Next.js (React-based, most popular for headless commerce)
- Nuxt (Vue-based, great DX)
- Astro (content-focused, fastest)
- SvelteKit (smallest bundle sizes)
Layer 2: Commerce Backend
What it does: Product catalog, inventory, orders, customer data, cart logic.
Scale requirements:
- Support 50K+ SKUs with variants
- Process 200+ orders per hour during peaks
- Real-time inventory updates across channels
- Multi-warehouse allocation
Technology options:
- Shopify Plus (managed, fastest to market)
- Medusa.js (open source, maximum flexibility)
- Saleor (GraphQL-native, international focus)
- Custom Rails/Node/Django (full control, highest effort)
Layer 3: Payment Processing
What it does: Credit card processing, alternative payments, fraud detection.
Compliance requirements:
- PCI DSS Level 1 compliance
- 3D Secure 2.0 support (EU requirement)
- Alternative payment methods (PayPal, Apple Pay, Klarna, Afterpay)
- Multi-currency support
Technology options:
- Stripe (developer-friendly, excellent APIs)
- Adyen (enterprise-grade, omnichannel)
- Braintree (PayPal integration)
- Authorize.net (traditional enterprise)
Layer 4: Search and Discovery
What it does: Product search, filtering, recommendations, autocomplete.
Performance requirements:
- Sub-300ms search response times
- Relevance tuning (search “blue shirt” should find navy, cobalt, azure)
- Typo tolerance (“conputer” finds “computer”)
- Faceted filtering (price ranges, brands, attributes)
Technology options:
- Algolia (fastest implementation, hosted)
- Elasticsearch (self-hosted, full control)
- Meilisearch (open source Algolia alternative)
- Typesense (open source, fast)
Layer 5: CDN and Media
What it does: Serve images, videos, static assets globally with low latency.
Requirements:
- Global edge network (sub-100ms latency worldwide)
- Image optimization (WebP, AVIF, lazy loading)
- Video streaming (product demos, reviews)
- Asset versioning and cache invalidation
Technology options:
- Cloudflare (enterprise CDN, DDoS protection)
- Cloudinary (image optimization, transformations)
- Imgix (real-time image processing)
- AWS CloudFront (integrated with AWS stack)
Layer 6: Data and Analytics
What it does: Track user behavior, conversion funnels, revenue attribution, inventory forecasting.
Requirements:
- Real-time dashboards (revenue, traffic, conversion)
- Customer lifetime value tracking
- Attribution modeling (which channels drive revenue)
- Inventory turnover analysis
Technology options:
- Google Analytics 4 (free, standard)
- Segment (customer data platform)
- Mixpanel (product analytics)
- Amplitude (behavior analytics)
- Custom data warehouse (Snowflake, BigQuery)
The Winning Stack for $10M Revenue
Based on 15+ implementations, here’s the architecture that consistently scales from $1M to $10M+ without major rewrites:
Option A: Speed to Market Stack
Best for: Companies currently at $1M-$3M targeting $10M within 2-3 years. Limited technical team. Need to validate product-market fit quickly.
Architecture:
Frontend: Next.js (React) deployed on Vercel
Commerce Backend: Shopify Plus
Payments: Shopify Payments (or Stripe)
Search: Algolia
CDN: Shopify’s built-in CDN
Analytics: Google Analytics 4 + Shopify Analytics
Why this works:
- Fastest time to market (6-10 weeks from zero to launch)
- Proven scalability (Shopify handles $1B+ merchants)
- Minimal DevOps overhead (Shopify manages infrastructure)
- Best-in-class checkout conversion (Shopify optimizes constantly)
- Extensive app ecosystem (add features without custom development)
Trade-offs:
- Monthly platform costs: $2,000+ (Shopify Plus) + $500+ (apps)
- Limited backend customization (stuck with Shopify’s data model)
- Transaction fees if not using Shopify Payments (2% on all sales)
Total Cost of Ownership (annual at $10M revenue):
| Component | Cost |
| Shopify Plus | $24,000-$40,000 |
| Apps and integrations | $12,000-$24,000 |
| Vercel hosting | $3,000-$6,000 |
| Algolia search | $6,000-$12,000 |
| Development maintenance | $48,000-$72,000 |
| Total | $93,000-$154,000 |
ROI: Fastest revenue growth due to minimal technical drag. Focus resources on marketing and customer acquisition instead of infrastructure.
Option B: Control and Flexibility Stack
Best for: Companies at $3M-$5M with strong technical team. Need custom business logic. International expansion planned.
Architecture:
Frontend: Next.js (React) on Vercel
Commerce Backend: Medusa.js (Node.js) self-hosted
Database: PostgreSQL on AWS RDS
Payments: Stripe
Search: Meilisearch self-hosted
CDN: Cloudflare
Analytics: Segment + Mixpanel
Why this works:
- Zero platform fees (only infrastructure costs)
- Complete customization (modify any business logic)
- Data ownership (everything in your database)
- API-first architecture (easy integrations)
- Open source (no vendor lock-in)
Trade-offs:
- Higher initial development cost (16-20 weeks to launch)
- DevOps required (database management, server monitoring)
- Checkout conversion optimization is your responsibility
- PCI compliance complexity (handling payment data)
Total Cost of Ownership (annual at $10M revenue):
| Component | Cost |
| AWS infrastructure | $18,000-$36,000 |
| Cloudflare | $2,400-$6,000 |
| Stripe fees (2.9% + 30¢) | $295,000 (pass-through) |
| Development and maintenance | $96,000-$144,000 |
| DevOps engineer | $60,000-$90,000 |
| Total | $176,400-$276,000 |
ROI: Higher control enables unique features that differentiate from competitors. Better margins long-term due to no platform fees.
Option C: International Powerhouse Stack
Best for: Companies selling across US, UK, EU, Australia. Multiple currencies and languages. Complex product catalogs.
Architecture:
Frontend: Next.js with i18n (internationalization)
Commerce Backend: Saleor (Python/GraphQL)
Database: PostgreSQL (multi-region replication)
Payments: Adyen (supports 250+ payment methods globally)
Search: Algolia (multi-language support)
CDN: Cloudflare (global edge network)
Analytics: Segment + Google Analytics 4
Why this works:
- Built-in multi-currency support
- GraphQL API (efficient for complex queries)
- Multi-warehouse inventory allocation
- Tax calculation for 100+ jurisdictions
- Strong EU/UK market support
Trade-offs:
- GraphQL learning curve (less common than REST)
- Longer implementation timeline (20-24 weeks)
- Higher development costs (specialized skills)
Total Cost of Ownership (annual at $10M revenue):
| Component | Cost |
| Saleor Cloud | $12,000-$24,000 |
| Infrastructure | $24,000-$36,000 |
| Adyen fees | $295,000 (pass-through) |
| Algolia | $12,000-$18,000 |
| Development | $120,000-$180,000 |
| Total | $168,000-$258,000 |
ROI: Captures international revenue other platforms miss. One global platform vs separate regional sites reduces operational complexity.
Database Architecture: The Foundation
Your database choice determines long-term scalability more than any other decision.
PostgreSQL: The Default Choice
Why PostgreSQL wins for eCommerce:
- ACID compliance: Transactions are reliable (critical for order processing)
- JSON support: Store flexible product attributes without schema changes
- Full-text search: Built-in search capabilities (good for small catalogs)
- Mature ecosystem: 30+ years of development, battle-tested
- Horizontal scaling: Read replicas for performance, sharding for massive catalogs
When PostgreSQL struggles:
- Catalog size above 500K SKUs (queries slow down)
- More than 10,000 concurrent connections (connection pooling required)
- Real-time analytics on billions of events (need dedicated analytics database)
Real-world example:
A client with 45K SKUs, 500K orders/year, processing on PostgreSQL (AWS RDS):
- Database size: 280GB
- Query performance: 95% of queries under 50ms
- Backup strategy: Daily snapshots, point-in-time recovery
- Cost: $3,200/month for production database
MongoDB: When Flexibility Matters
Use MongoDB if:
- Product catalog has highly variable attributes (electronics with specs vs apparel with sizes)
- Frequent schema changes (adding new product types often)
- Document-based data model matches business logic
- Strong Node.js ecosystem preference
Skip MongoDB if:
- Complex joins required (inventory + orders + customers)
- ACID transactions critical (order processing)
- Team lacks NoSQL expertise
Redis: The Speed Layer
Regardless of primary database choice, Redis provides critical performance boosts:
Use cases:
- Session storage: User cart, authentication tokens
- Rate limiting: Prevent API abuse
- Cache layer: Product data, category pages
- Real-time inventory: Fast reads for stock levels
Performance impact:
Product page load time without Redis cache: 380ms
Product page load time with Redis cache: 45ms
Improvement: 88% faster
Payment Architecture: Balancing Cost and Conversion
Payment processing is where technology meets revenue directly.
The Stripe Advantage
Why Stripe dominates:
- Excellent APIs (best developer experience)
- Fast onboarding (live in days, not months)
- Strong fraud detection (Stripe Radar)
- Subscription support built-in
- 135+ currencies supported
Pricing:
- 2.9% + 30¢ per transaction (US)
- Volume discounts start at $1M/month processed
- No monthly fees
At $10M revenue: $295,000 in processing fees annually
When Stripe isn’t optimal:
- Enterprise volume (negotiated rates available from competitors)
- Complex multi-party marketplace splits
- Extremely high-risk industries
The Adyen Alternative
When to choose Adyen:
- International from day one (250+ payment methods)
- Omnichannel needs (online, mobile, in-store unified)
- Enterprise pricing (better rates above $50M processed)
- Unified reporting across regions
Pricing:
- Interchange-plus model (more complex but potentially cheaper)
- Typical effective rate: 2.5% to 2.8%
- Monthly minimums apply
At $10M revenue: $265,000 in processing fees (10% savings vs Stripe)
Payment Optimization Strategies
- Split routing: Route transactions to cheapest processor based on card type and geography. Saves 0.2% to 0.4% on total transaction volume.
- Network tokens: Replace card numbers with network tokens (Visa, Mastercard). Improves authorization rates by 2-3%, increases revenue directly.
- Dynamic 3DS: Apply 3D Secure only when fraud risk detected. Reduces cart abandonment while maintaining fraud protection.
Impact of 1% improvement in payment authorization rate at $10M:
Failed authorizations: 2% typically
1% improvement: Authorization rate from 98% to 98.5%
Additional revenue captured: $50,000 annually
Performance Architecture: Speed as a Feature
Site speed directly impacts revenue. Google research shows 1 second delay reduces conversions by 20%.
The Performance Budget
For $10M revenue platforms, target these metrics:
| Metric | Target | Impact if Missed |
| Time to First Byte | < 600ms | Poor SEO rankings |
| Largest Contentful Paint | < 2.5s | Google penalties |
| First Input Delay | < 100ms | Feels sluggish |
| Cumulative Layout Shift | < 0.1 | Annoying UX |
How to achieve this:
- Static generation where possible
Product pages, category pages, content pages should be pre-rendered HTML (not server-rendered on every request).
Next.js Static Generation approach:
- Build static HTML for 10K most-viewed products
- Serve from CDN (sub-50ms delivery globally)
- Regenerate daily or on product updates
Performance: Product page loads in 0.4 seconds vs 2.1 seconds for server-rendered.
- Image optimization
Images typically represent 50-70% of page weight.
Strategy:
- WebP format (30% smaller than JPEG)
- Lazy loading (only load images in viewport)
- Responsive images (serve correct size per device)
- CDN delivery (Cloudinary or Imgix)
Impact: Page weight from 3.2MB to 450KB (86% reduction)
- Database query optimization
Slow database queries kill performance at scale.
Common problems:
- Missing indexes (queries scan entire tables)
- N+1 queries (fetching related data inefficiently)
- Returning unnecessary columns (SELECT * instead of specific fields)
Real example:
Product listing page query before optimization: 1,200ms
After adding proper indexes and query restructuring: 35ms
Improvement: 97% faster
Caching Strategy
Multi-layer caching prevents database overload:
Layer 1: CDN cache (serves 80% of requests)
- Product images, CSS, JavaScript
- Static HTML pages
- TTL: 24 hours
Layer 2: Application cache (Redis, serves 15% of requests)
- Product data, pricing
- Category listings
- TTL: 1-5 minutes
Layer 3: Database query cache (serves 5% of requests)
- Complex queries with frequent reuse
- TTL: 30 seconds
Result: Only 5% of traffic hits database. Database handles 500 requests/second vs 10,000 without caching.
Scaling Architecture: Handling Growth
The difference between $3M and $10M isn’t just 3x traffic. Complexity increases non-linearly.
Horizontal Scaling Strategy
Web tier:
- Deploy multiple server instances (auto-scaling)
- Load balancer distributes traffic
- Kubernetes or ECS for container orchestration
- Scale from 2 servers to 20 automatically based on traffic
Database tier:
- Read replicas for query performance (5-10 replicas)
- Write to primary, read from replicas
- Connection pooling (PgBouncer for PostgreSQL)
Cache tier:
- Redis cluster (multiple nodes)
- Automatic failover
- 100GB+ memory for hot data
Cost at Different Revenue Scales
| Revenue | Servers | Database | Cache | CDN | Total Monthly |
| $1M | 2 instances | Single DB | 2GB Redis | 500GB | $800 |
| $3M | 4 instances | DB + replica | 8GB Redis | 2TB | $2,100 |
| $5M | 8 instances | DB + 2 replicas | 16GB Redis | 5TB | $4,800 |
| $10M | 15 instances | DB + 5 replicas | 32GB Redis | 15TB | $11,200 |
Pattern: Infrastructure costs scale sub-linearly with revenue (great for margins).
The Migration Path: Evolving Your Stack
Most $10M platforms started on simpler technology. Here’s how to evolve:
Phase 1: $0 to $1M (Validate Product-Market Fit)
Stack: Shopify standard, out-of-box theme, minimal customization
Focus: Product selection, marketing, customer acquisition
Don’t worry about: Custom features, complex integrations, performance optimization
Phase 2: $1M to $3M (Optimize Conversion)
Stack upgrade: Custom Shopify theme or Shopify + headless frontend
Investments:
- Professional design (custom brand experience)
- Conversion rate optimization (A/B testing, personalization)
- Email marketing automation (Klaviyo)
- Advanced analytics
Phase 3: $3M to $7M (Scale Efficiently)
Stack decision point: Stay on Shopify Plus or migrate to open-source platform
Considerations:
- Do you need custom business logic Shopify can’t provide?
- Is the 2% transaction fee ($60K at $3M, $140K at $7M) justified?
- Do you have technical team to manage custom stack?
If yes to all three: Migrate to Medusa.js or Saleor
If no: Stay on Shopify Plus (it scales to hundreds of millions)
Phase 4: $7M to $10M+ (International and Optimization)
Focus:
- International expansion (new markets)
- Advanced personalization (AI recommendations)
- Subscription offerings (recurring revenue)
- Mobile app launch (native iOS/Android)
Technology additions:
- Multi-region deployment (US, EU, Asia data centers)
- Advanced analytics (customer lifetime value modeling)
- Warehouse management system (multi-location inventory)
Key Decision Framework
Use this framework to evaluate technology choices:
Question 1: What’s your current revenue and 2-year target?
Under $1M targeting $3M: Shopify standard → Shopify Plus
$1M-$3M targeting $10M: Shopify Plus with headless frontend
$3M-$5M targeting $10M+: Consider open-source (Medusa, Saleor)
Question 2: How technical is your team?
Non-technical (marketing-led): Shopify Plus (minimal dev needed)
Developers but small team: Shopify Plus with custom frontend
Strong development team: Open-source platforms (full control)
Question 3: How differentiated is your business model?
Standard B2C retail: Shopify Plus works great
B2B with custom pricing: Need custom backend
Subscription-heavy: Custom or Shopify Plus with Recharge
Marketplace: Custom platform required
Question 4: International expansion timeline?
US/Canada only: Any platform works
Expanding to EU/UK within 1 year: Saleor or Shopify Plus
Multi-region from day one: Saleor or custom
Common Mistakes That Cap Growth
Mistake 1: Premature Optimization
What happens: Company at $500K revenue builds custom platform optimized for $50M scale.
Cost: $200K+ in development, 9-month build time, no revenue during build.
Better approach: Use Shopify, focus on customer acquisition, optimize when you have revenue to justify it.
Mistake 2: Vendor Lock-In Ignorance
What happens: Build entire business logic in Shopify’s Liquid templates and apps. Realize at $5M that migration would cost $300K.
Prevention: Keep business logic in custom apps or separate services, use Shopify as data layer only.
Mistake 3: Ignoring Mobile Performance
What happens: Site works great on desktop (2s load time) but terrible on mobile (8s load time). Lose 60% of mobile traffic.
Impact: At $10M revenue with 70% mobile traffic, poor mobile experience costs $4.2M annually.
Mistake 4: Database Design Shortcuts
What happens: Use database as dump for all data without proper schema design. At 100K orders, queries take 10+ seconds.
Fix cost: $50K+ database migration and application refactoring.
Prevention: Design schema properly from day one. Use indexes. Test with realistic data volumes.
How Askan Technologies Builds for Scale
As an ISO-9001 certified development partner with 200+ successful projects across US, UK, Australia, and Canada, we’ve architected eCommerce platforms from $1M to $50M+ in revenue.
Our Scalable eCommerce Approach:
- Revenue-Based Architecture: We design for your current revenue + 3x growth (not over-engineering, not under-building)
- Platform Selection Consulting: Honest assessment of Shopify Plus vs open-source based on your actual needs
- Performance First: Sub-2-second page loads guaranteed, tested under load
- Cost Optimization: Right-size infrastructure to avoid waste
- International Ready: Multi-currency, multi-language, tax compliance from launch
- Migration Expertise: Smooth transitions from Shopify standard to Plus, or Plus to custom platforms
Recent $10M+ Platforms:
- Fashion brand: Shopify Plus + Next.js handling 400K monthly visitors
- B2B industrial: Medusa.js with custom pricing engine, $18M revenue
- Multi-market electronics: Saleor across US, UK, EU, $15M revenue
We deliver platforms with our 98% on-time delivery rate and 30-day free support guarantee. Your path to $10M starts with the right technology foundation.
Key Takeaways
- $10M revenue requires 150K-400K monthly visitors with 99.9% uptime and sub-2-second page loads
- Shopify Plus fastest to $10M for standard retail (6-10 weeks to launch, proven scalability)
- Open-source platforms (Medusa, Saleor) better for custom business logic but require technical team
- Database architecture determines long-term scalability more than any other decision (PostgreSQL default choice)
- Payment optimization saves $30K-$100K annually through routing, network tokens, and fraud reduction
- Performance improvements directly increase revenue with 1-second faster load time improving conversions 20%
- Infrastructure costs scale sub-linearly so margins improve as revenue grows ($800/month at $1M, $11K/month at $10M)
Final Thoughts
The technology decisions you make at $1M-$3M determine whether you’ll reach $10M or plateau at $5M due to technical constraints.
The right stack balances three factors: speed to market, operational costs, and scalability headroom. Shopify Plus wins for most mid-market eCommerce companies because it optimizes all three. Open-source platforms win when custom business logic justifies the higher implementation and operational costs.
What never works: building custom platforms prematurely, ignoring performance until it’s too late, or choosing technology based on developer preferences rather than business requirements.
Your technology stack should be invisible to customers (fast, reliable, always available) and efficient for your team (easy to update, low maintenance, clear monitoring).
Start with the simplest stack that handles your current revenue plus 3x growth. Invest the savings in customer acquisition. Upgrade when you hit actual limits, not theoretical ones.
The companies reaching $10M in 2026 are those that spent 2024-2025 focused on customers and product, not rebuilding their tech stack every 18 months.
Build for today’s revenue, architect for tomorrow’s growth, and never let technology become the excuse for not scaling.
Most popular pages

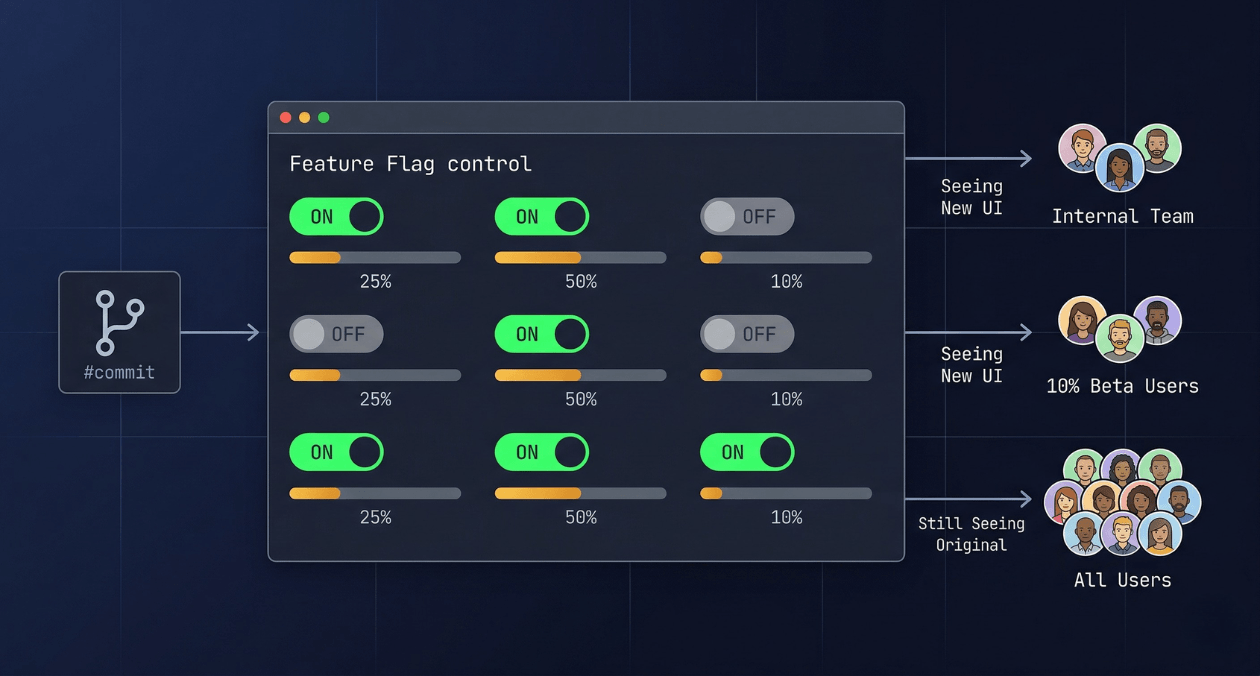
Feature Flags in Production: Progressive Delivery Without the Risk
The deploy button used to mean something definitive. You shipped code, users got the new version, and if something broke you scrambled to roll...
-
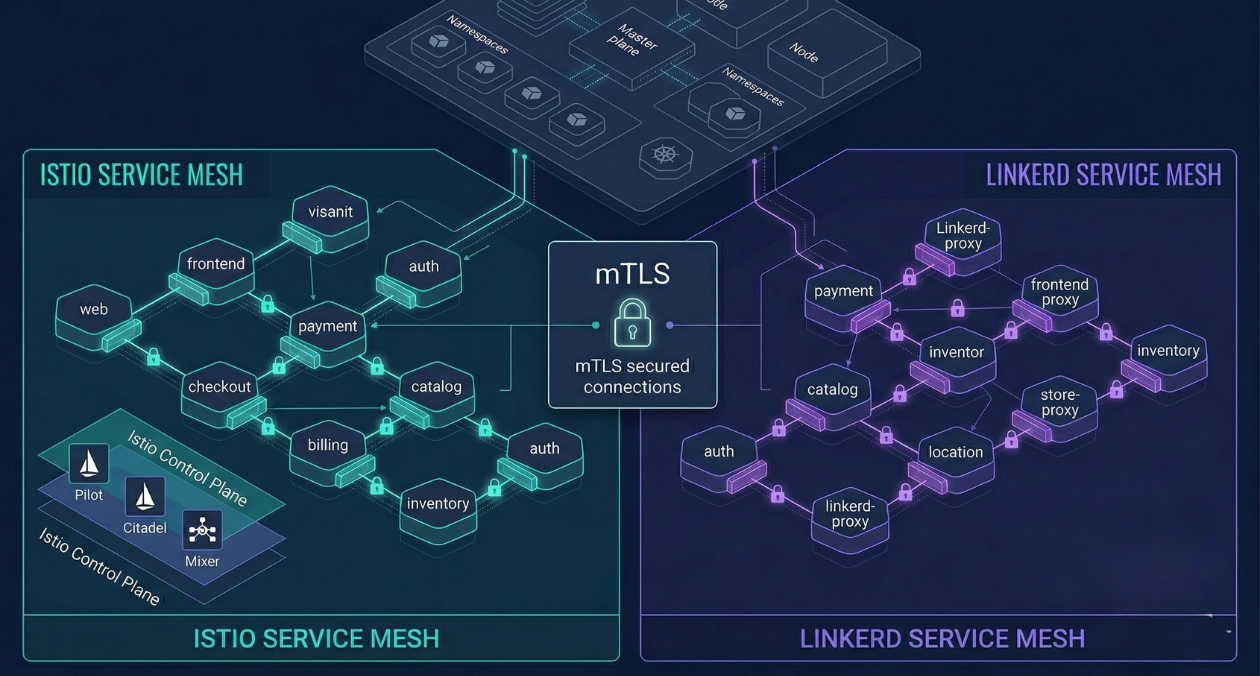
Service Mesh Architecture: When Istio and Linkerd Are Worth the Complexity
There is a specific moment in the growth of a microservices platform when the operational questions start arriving faster than the answers. How do...
-
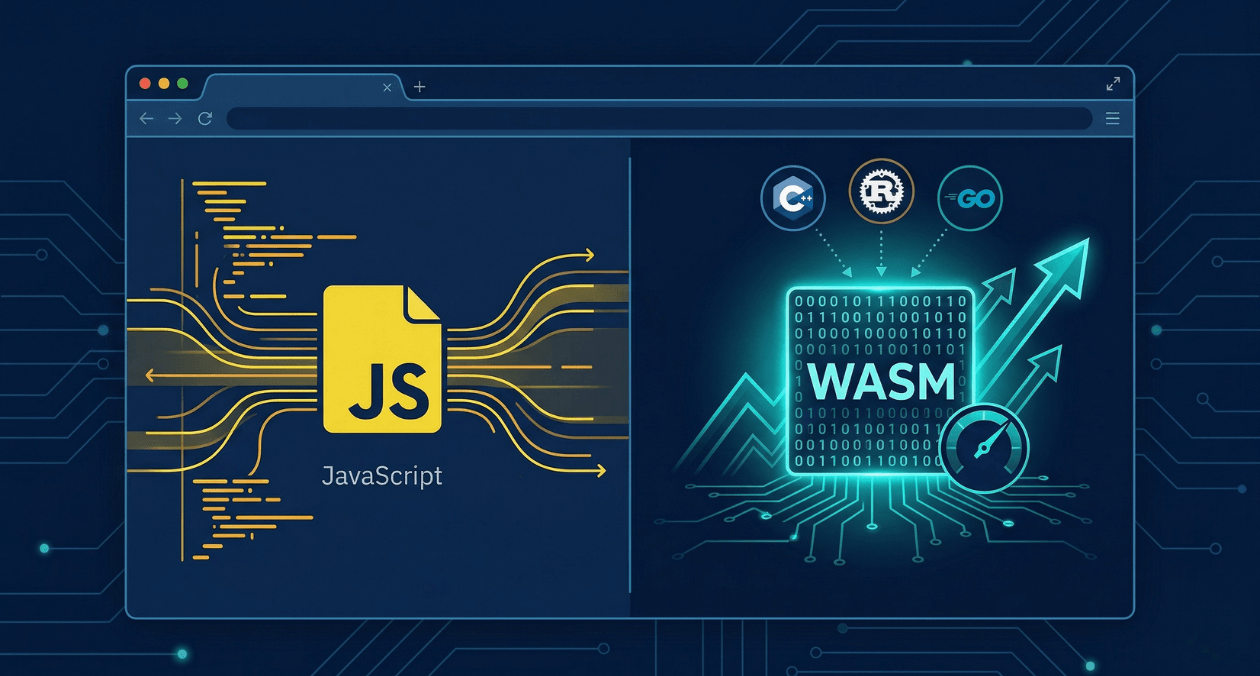
WebAssembly in 2026: Performance, Use Cases and When to Use It in Production
WebAssembly has been in the conversation for nearly a decade, but 2026 is the year more engineering teams are moving it from experimental to...
Feature Flags in Production: Progressive Delivery Without the Risk
The deploy button used to mean something definitive. You shipped code, users got the new version, and if something broke you scrambled to roll...
Service Mesh Architecture: When Istio and Linkerd Are Worth the Complexity
There is a specific moment in the growth of a microservices platform when the operational questions start arriving faster than the answers. How do...
WebAssembly in 2026: Performance, Use Cases and When to Use It in Production
WebAssembly has been in the conversation for nearly a decade, but 2026 is the year more engineering teams are moving it from experimental to...